Users: Tomb: All Pages
Gold Weekly LOG.png
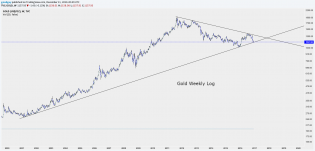
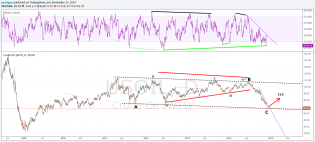
Gold: Weekly log: at a decision point?

2
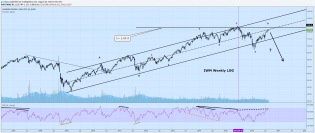
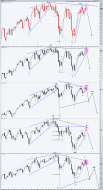
Chart 2 Russell 2000 weekly log with channel.png
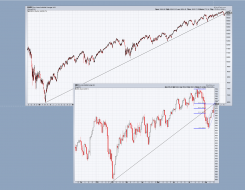
Here is the second chart. Posting two charts that suggest to me that this would be an excellent time for the Russ...
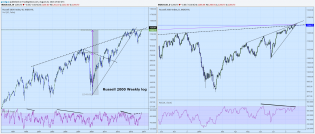
Chart1 Russell 2000 weekly and daily log.png
Posting two charts that suggest to me that this would be an excellent time for the Russell 2000 to reverse. Also s...
2
XLF DAILY LOG.png
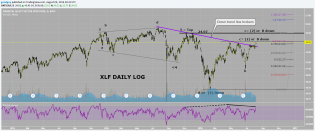
This bear is still holding on. (at least for a little while longer). Here is a chart of XLF in where a down trend...
1
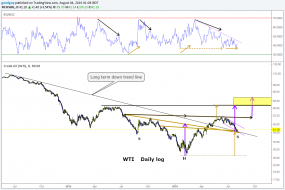
wti daily log.png
USOIL: looks like a good set up for "kiss and run" (up). Strong up day right at the longer term down trend line.
4
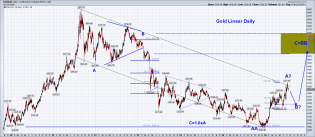
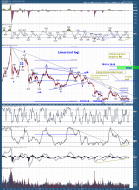
Gold Linear Daily.png
Gold: would not be surprised to see some correction here. Dink suggested I try some channels with non log charts....
1
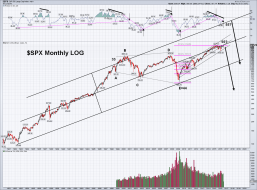
SPX Monthly.png
SPX Montly LOG: Bullish of Bearish??
For the bulls: 1. Very long term trend UP. 2 Intermediate term trend UP...
5
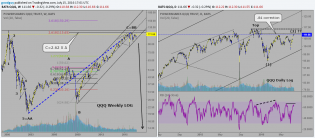
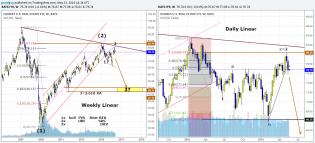
QQQ weekly and daily log.png
One more effort to cheer Tim up: QQQ shows relationships which to me suggest a major turn may happen soon. I see...
4
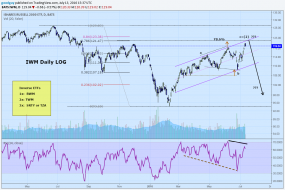
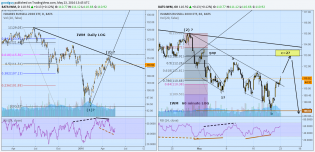
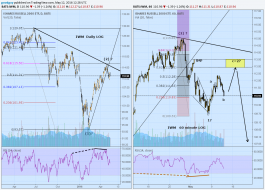
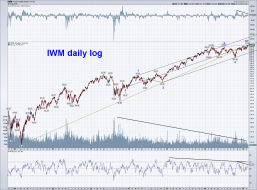
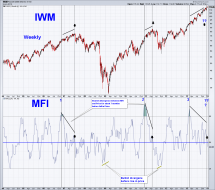
IWM Daily LOG.png
Here is my current view of the small caps. The weekly chart (not shown) has developed a negative reversal in the R...
4
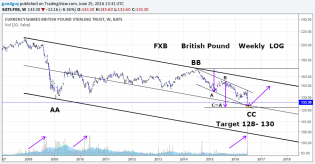
FXB British Pound Weekly log.png
I don't trade the currencies the way some of you do. So I am sure you have a much better way to trade this. But ju...
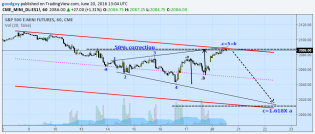
S& P 500 futures.png
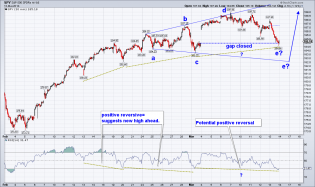
S&P 500: Still hope for the bears?
I have been thinking the price action in the major US indices looked like kind...
4
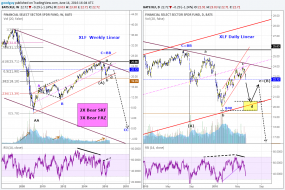
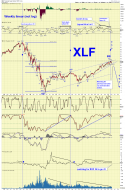
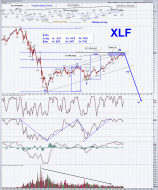
Update on financials XLF.png
2 months ago I posted on XLF suggesting the top was likely in (see previous post). As I review the price action is m...
Weekly canles suggest more downside ahead.png
Notice the weekly candle formation for some of the major indices. This is also my current view of what I see as a...
1
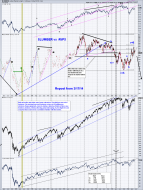
Lumber.png
Lumber breaks down again. This is a chart I have been posting since 2014. This time I added homebuilders and rea...
3
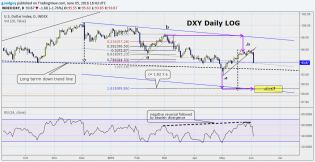
DXY projected target.png
2 weeks ago I suggested the DXY was about to fall (see previous post). I thought at that time the point".b" would st...
3
Real Estate IYR Weekly and Daily.png
I am still bearish on real estate. But after seeing the IWM correction as as EWT irregular flat (see recent postin...
2
IWM Daily and 1 hour.png
Update on my posting of about 2 weeks ago. My target has stayed the same with a .62 correcion and possibly closing...
3
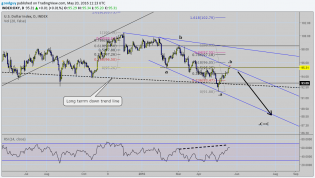
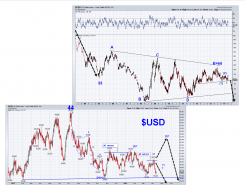
USDollar Index Daily Log.png
Is the US Dollar about to fall?
US Dollar Index daily log: We have now developed a fairly large negative reversal...
2
IWM daily and 1 hour log.png
Notice the major up move from around 2/10 was almost a .62 correction (on daily chart). I favor the most recent u...
2

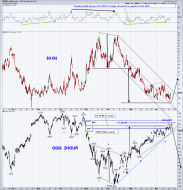
Oil and Gas Index Daiy LOG.png
Oil and Gas Index. Two trend lines to watch. The index broke out of a long term down trend line. Will resistance b...

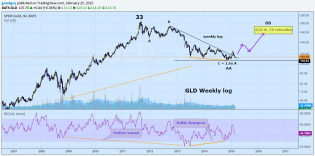
GLD Weekly and daily log.png
Weekly and daily log of GLD. Correction soon?
Looks to me like once we reach the short term target (yellow box)...
1
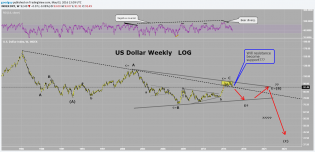
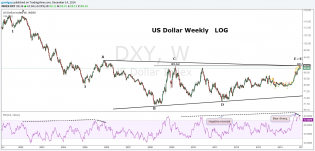
US Dollar Weekly LOG.png
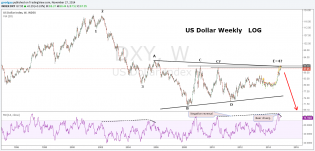
US Dollar Weekly Log: Will resistance become support?
I've been looking at the longer term view of the dollar....
1
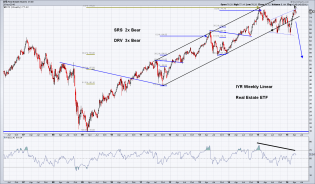
Weekly IYR linear.png
IYR Weekly linear chart: Is real estate about to fall? I think it is very likely. The daily chart gives me a sel...
2
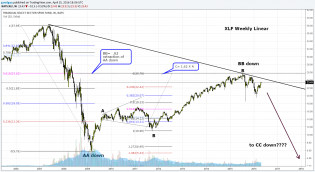
XLF Weekly Fib.png
XLF weekly linear Interesting Fibonacci relationships the way I see it. In EWT B waves not infrequently are tr...
1
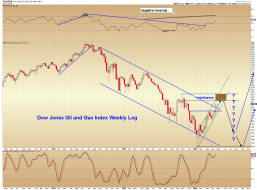
oil and gas weekly log.png
Oil and Gas weekly log chart with RSI: There has been a break this week of the long term downtrend line in this se...
3
XLF daily log..png
Indu daily log.png
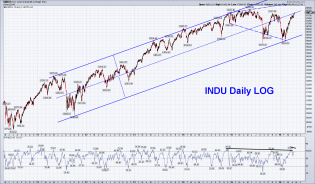
INDU daily log: I know trying to guess tops is a fools game but sometimes I like to play games. Would not be a ba...
5
$VXN with QQQ 2 hour.png
Follow up from my chart of about 2 weeks ago with a target of 110.5-112 for QQQ. This has happened and a good siz...
Looks bearish to me daily.png
This one is for Tim. After looking at Tim's charts for a year or so I thought I would try it out. No indicators. D...
3
Daily Gold Log with target.png
Gold: One more leg up before correction?
Daily Log chart. In February I posted a weekly chart showing gold had...
WeeklyLOG INDU with fan.png
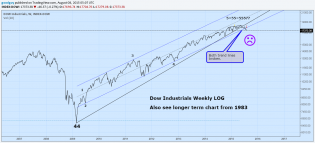
INDU weekly log: Top in for the dow industrials? I think likely.
In February I posted this log weekly with the...
3
VXN QQQ 2 hoursc.png
QQQ correction about over? I think likely. Here is the 2 hour chart of the $VXN (volatility for the QQQ) vs the Q...
3
Weekly down with fan.png
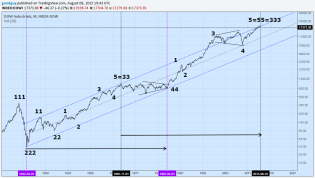
Dow Industrials Weekly LOG
Six months ago I published this chart thinking we were likely at THE top. The Dow Indu...
2

iwm daily log.png
IWM. Time to rise?
Nice looking 5 wave expanding triangle.
4
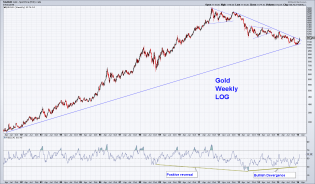
Gold weekly log.png
Gold weekly log: Gold breaks long term downtrend line.
2

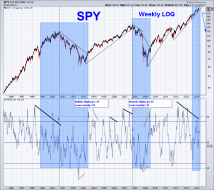
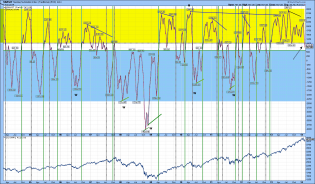
spy iwm long term.png
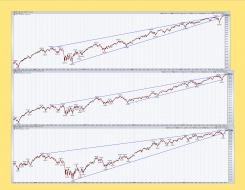
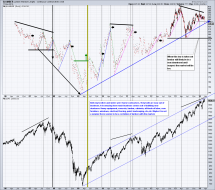
Stocks: One more charge still in the bull?
I like to sometimes stand back and look at the longer term picture. He...
4

$SPX dailysc.png
10.19 Nice Pitchfork SPX Daily linear. Will rising support become real resistance this time? I think so.
Dow monthly 2.png
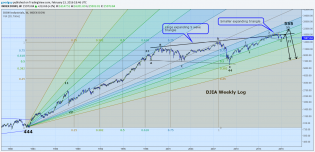
Monthly log DJIA One last chart. Then I wont bother anyone again for a few months. I like this last chart as it f...
4
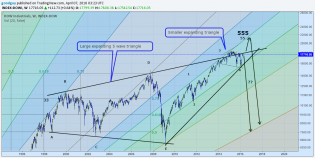
Dow weekly 2.png
I know most of you think nothing of EWT for many reasons. But iffffffffffffff my count is correct then it suggests...
6
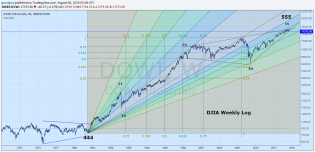
Dow Weekly with fan.png
Dow weekly with Fib fan
3
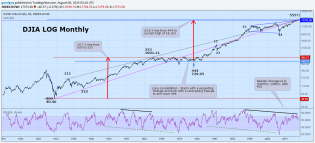
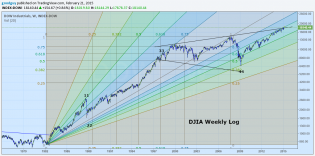
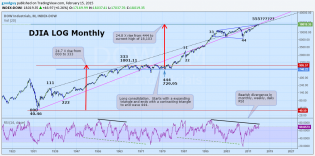
Dow monthly.png
Long term view of the dow: I will post 3 charts. Starting with a monthly chart I first posted in 2/15 when the dji...
4

spy weekly line break.png
SPY Weekly Close: You can see that with Fridays down day the SPY did close below the rising trend line. Of course...
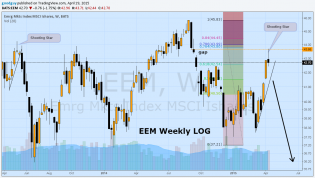
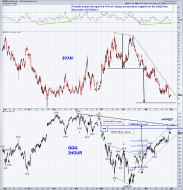
EEM Weekly log.png
EEM Weekly LOG: Last week I suggested that EEM may be about to fall but wait for sign of reversal. Friday's down a...
3

SPX vs Lumber.png
Moment of truth. Good morning slopers. I may be wrong but I am persistent. It appears to me the long term term tre...
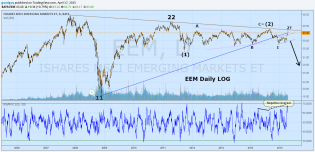
download.png
EEM Emerging markets Daily LOG: Short term the emerging markets are on a tear up. But from a longer perspective th...
GLD.png
This is my long term current view of gold. I have a similar view for silver. Personally I think both gold and silv...

Lumber vs SPX.png
This goes into the Tom B thinks this is interesting column hope you do too. I posted this same chart on 3.17.14....
6
download.png
I love this chart.
In 1982 I was a young man and I remember there was a tremendous excitement (there were no...
IWM daily log.png
Last Bear standing???? Before you trend followers (ie smart money making traders) make fun of this please note tha...
6
Dow In monthly.png
Is the Dow Industrials at a long term major top?
Of course no one really knows the answer to that but this chart...
Long term US dollar Index.png
US Dollar long term log chart. Obviously the dollar has been charging upward recently. But if you look at the lon...
1
Weekly US dollar log.png
I still think there is a good chance the US dollar has been forming a long term 5 wave triangle (ABCDE) before one...
1
Crude Oil Daily.png
Crude about to reverse? Would not be surprised to see crude oil reverse soon. Fits with the way I see the US dol...
1
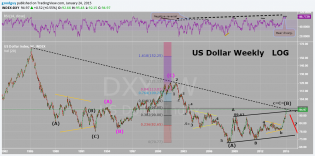
US Dollar Weely LOG.png
US Dollar: about to change direction? I see US Dollar as completing a long term triangle and favor there will be...
3

iwm and volitility.png
As we all know usually there is a inverse relationship between the volatility and trend. Here is post processing o...
1
log SPY QQQ XLF.jpg
When I first became interested in stock analysis I noticed sometimes there was what I called "the low before THE h...
1
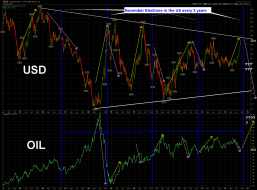
$USD OIL US elections.png
USD vs OIL with US elections every two years. Just because two things happen at the same time doesn't mean one is...
3
indu.png
INDU Log chart daily from 2009. Will support become resistance? Approx 62% retracement. Will see tomorrow. Have...
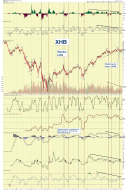
XHB weekly 7.31sc.png
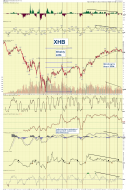
XHB Weekly log. Just a follow of my chart of 6/20 when XHB was 32.15. I would not be surprised to see a drop to...
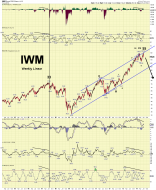
IWM weekly linear 7.20.14.png
Russell 2000. Weekly linear chart. Please also see RUT weekly log chart posted today. This is a follow up of a...
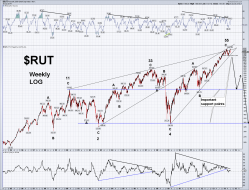
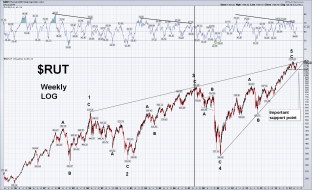
$RUT Weekly log 7.20.14.png
Russell 2000. Weekly log chart. Please also see IWM weekly linear chart posted today. This is a follow up of a...
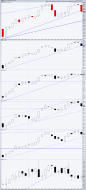
Snapshot 6.24 daily candlessc.png
Daily charts. A lot of reversal and shooting star type candles here today. Should be good to bearish types for...

IWM Monthly month 64sc.png
64 Month bubble? After seeing the interesting post Tim made o...
2
XHB homebuilders weekly 6.22.14.png
Homebuilders running out of steam? When there is a negative divergence in multiple indicators it often leads to a...
1
$RUT Weekly LOG 6.22.14.png
$RUT weekly log: This is a follow up a post I made on 10/18/13. At that time I said: "One pattern formation that...

SPY 5.12.14daily.png
Spy daily. Slopers am I crazy? I participate on this site to learn and to share. So give me some feedback here...
3

QQQ 2hour 5.10.14sc.png
QQQ 2hour. I’ve noticed that the price action of QQQ is a series of a-b-c zigzags. One possible pattern is gi...
1

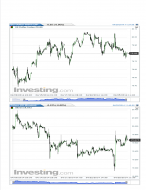
TLT daily 4.27sc.png
TLT daily: After looking at the daily chart of TLT I think the downtrend may start soon. Personally I plan to take...

TLT weekly sc.png
TLT Weekly long term: This is my read on long term US bonds. It agrees with the excellent chart posted by Mike 19...
2

$CPCE daily with 50 MAsc.png
$CPCE daily with the 50 day MA: Some folks see the put/call ratio as an inverse sentiment indicator. It fluctuat...
silver vs dollar intraday.png
30 min US dollar vs silver...

QQQ 2 hoursc.png
QQQ 2 hour: here is a follow up of my 4.11 chart of QQQ which turned out to be accurate. Now we are at the decisio...
XLF weekly sc.png
Weekly XLF non-log chart: Is XLF set up for a fall? Always a dangerous call in this market. But the set up seems r...
2

SILVER daily sc.png
Silver daily: With the drop in precious metals today I thought I would share my read on silver. To me it has mad...
2
$USD daily 4.11.14.png
US Dollar daily: Since I am interested in precious metals I follow the US dollar which is one influence on the pr...

QQQ 2 hour 4.11.14.png
QQQ 2hour. The recent action shows 5 overlapping waves each of which each has a a-b-c (3 wave) form. This shows a...

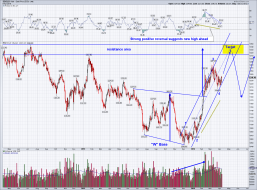
GDX daily log 4.9.14sc.png
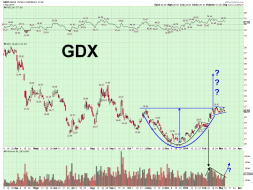
Good eve. Here are some reasons GDX looks positive to me: bullish engulfment in the daily candle today, recently...
7
spy weekly vs MFIsc.png
Weekly SPY vs MFI: To me this is an interesting chart but then again unlike many slopers I like indicators. Very o...
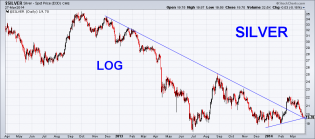
Silver daily log.png
Daily silver: Two potential support lines. I would not be surprised to see a upside reversal here. TGIF Have a...
long term lumbarsc.png
I know many of you do not use indicators. But I find this one interesting. I have been following the action of lum...
3
spy 30 min 3.13.14.png
Today with the down action in the major indices all of my short term indicators of trend for the indices went nega...
GDX daily 3..9.14sc.png
Previously I posted the smaller black "cup" which did breakout on increased volume. Looks to me like this formatio...
xlf weekly 3.6.14sc.png
For longer term traders you may be interested in following XLF. This is a f/u of a weekly chart I posted on 8/10/...
1
iwm 60 min. 2.17.sc.png
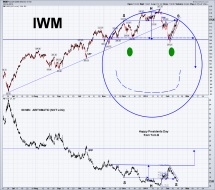
Happy Presidents Day from Tom B.
PS. I don't know if this will happen but it does seem possible. Have a great da...
1
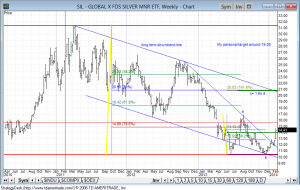
Sil Silver miners Weekly 2.14.png
Silver miners looks like a good bet to me. My personal target is around 19-20. Have a great Valentines Day and wee...
2
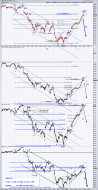
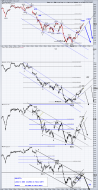
spy and stock indices update 15 min 2.11sc.png
Stock indices short term update from last week. Every one who saw the weekly hammer in some of the indices last we...
3
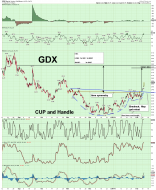
GDX 2 hour cup with handle2.11sc.png
Potential bullish pattern in gold miners. Short term overbought. May get retest or maybe not. Tom

TMF.png
Silver daily 2.9.14sc.png
Just an update on my view of silver (and gold is the same). Personally I think there is a good chance the last maj...
4
$NASIT ema4 long termsc.png
I personally think the QQQ is likely starting a major C wave down. Here is a long term chart of the NASIT (day ema...

$VXNsc.png
Another potential sign THE top is in. Take care. Enjoy the day. T.
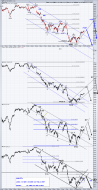
spy 15 min update2.7sc.png
Update from yesterday. All of these ETFs have now reached an important Fib correction. Will be interesting to se...
SPY 15 min after close.png
Follow up after the close of chart from early this morning. 3 of 4 charts broke downtrend lines. If longer term tr...

wave 1 15minsc.png
Not sure wave one down over but possible at this point. Waiting for down tend line break before we will know. Then...
1

Daily spy.png
Daily SPY. Last chart. Take care. T

spyweekly log.png
2nd of 3 charts

spy weekly linear.png
This is one of three charts to look at together on SPY. See discussion below thanks.
1
IWM weekly 1.9.14sc.png
IWM weekly with MFI. Just a follow up from a previous post. I noticed that the last two time there was a significant...
2

SPY 12.28.13sc.png
“You see what you look for; you recognize what you know.” This is a saying that I believe has a lot of truth...
1

QQQ IWM Time symmetry 12.26.13sc.png
Time symmetry? As QQQ appears to be at a channel top I noticed the time so far for C to develop is identical to th...
2