I've been trying to short overpriced-purveyor-of-spatulas Williams Sonoma for quite a while with hardly any success. At last, things are starting to break down over in hand-hammered copper-kettle land.
Slope initially began as a blog, so this is where most of the website’s content resides. Here we have tens of thousands of posts dating back over a decade. These are listed in reverse chronological order. Click on any category icon below to see posts tagged with that particular subject, or click on a word in the category cloud on the right side of the screen for more specific choices.
I've been trying to short overpriced-purveyor-of-spatulas Williams Sonoma for quite a while with hardly any success. At last, things are starting to break down over in hand-hammered copper-kettle land.
There's a mixed bag looking at my charts this morning. Copper and precious metals are looking weak, oil and forex strong, and equities could break either way. I'm looking for a move up to (finally) hit the ever-receding upper trendline of the rising wedge on the ES daily chart, and I might well get it if equities break up today. That target is now at 1293.5 ES. ES has formed what may be a bull flag since the high yesterday, but it is NQ that is looking really interesting this morning. On NQ a strong resistance trendline was broken a couple of days ago, and I've seen that referred to as a rising wedge, though if so, it isn't high quality. Since then however NQ has formed a smaller and much higher quality rising wedge, and it is that wedge that should define the direction of equities today. Rising wedges break up 30% of the time normally, but on the performance of these wedges within this strong uptrend of the last few months I'd put the probability of an upward break at more like 50%:

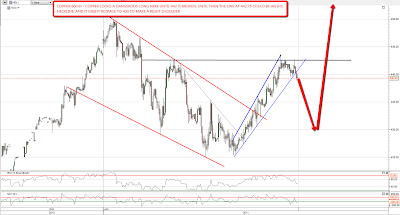
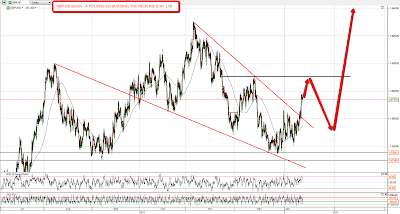
Silver is looking weak this morning and may be forming a large and rather ugly H&S. Copper failed at the neckline of a possible IHS yesterday and has given back most of yesterday's gains overnight. It was looking a bit stronger when I capped the chart below but I have marked in the possible retracement that we might see to make a right shoulder for the IHS:
Oil is looking very interesting today. as it is in a slightly messy but decent quality rising channel. There's a good chance of a double trendline support hit in the next two or three hours followed by a likely further move up. That would be an attractive long entry:

USD currency pairs are looking pretty strong overnight and I'm expecting some more dollar weakness. The GBPUSD rising wedge broke up yesterday and the obvious next target is the possible IHS neckline at 1.59. If USD has topped, which is possible, I'd then expect to see a retracement to make the RS and then a move to a new high:
EURUSD is a tougher call here as the short term chart doesn't offer much in the way of usable trendlines. In the absence of those the next obvious serious resistance is just over 1.34. That's still 250 pips away at the time of writing, but it is the obvious target on this move up if equities break up too:

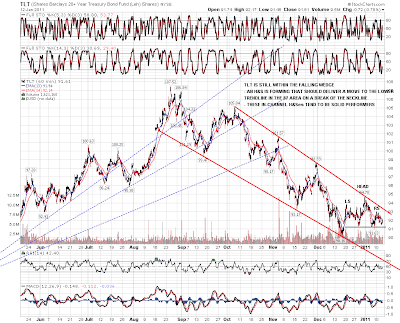
I was looking at the TLT chart this morning and the falling wedge that it has been moving down within since the announcements of QE2 last August. I have some serious doubts about whether it will make the next downside target as it would necessitate treasuries moving through a support level that would in all probability confirm the end of the 30 year old bull market in bonds. I'm expecting that confirmation in the next few months, but it is a big support level and I'd expect at least a pause there. Encouragingly I'm seeing an H&S form from the hit of the falling wedge upper trendline, and these in-pattern H&Ses are solid performers in my experience. If the neckline breaks with confidence I would therefore expect the next downside target in the 87 area to be hit:
Of all of these I'd pick NQ and oil as the most interesting plays today as both have clear support levels that should be hit early on and both have good odds of a strong rise after that support hits. In both cases a break of support would indicate more downside and they would become strong short candidates:
