Friday's rise was in line with the historical bullishness of the first trading day of the month, and April is of course historically the most bullish month of the year, but the strength of the rise on Friday was disappointing, and I'm wondering whether the first wave up from the March lows is petering out. Pug thinks so, and if so then I'd be expecting a moderate new high today, followed by a wave 2 retracement that should stay above strong support at 1300 ES. The trendlines on SPX and NDX aren't giving a lot away, but for what it's worth here are the 15min charts showing the current situation as I see it. Here's the SPX chart first:

Here's the Nasdaq / NDX 15min chart:

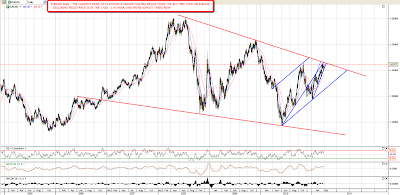
Copper is showing some strength this morning. after bouncing off a strong internal support / resistance trendline that I only picked up over the weekend, copper looks ready to retest 437.6, though it has to clear resistance at 431 to get there first of course. It has made a decent low with positive RSI divergence on the 60min chart, and coupled with the bullish break of the short term declining channel, I'm expecting a decent move up within what may well still be a larger downtrend. It's worth noting that both 431 and 437.6 are potential IHS necklines:

In terms of the health of the current advance the Dow made a new intraday high on Friday but failed to close at a new high, so there's no new Dow Theory Buy Signal as yet. We may see that new closing high today and it would be nice to have that confirmation, though the last Dow Theory Buy Signal was just before the February high of course and this should definitely be seen as a longer term bull market continuation signal rather than a short term directional signal. Vix closed the 16.88 gap that I've been watching, and has bounced since, but longer term I'm expecting Vix to head below 16 in the coming weeks:

More encouraging than either of those from the bull perspective however is the break up on EEM, which has now started to outperform SPX again after a several month period of underperformance. This is very encouraging for the bull side, and should signal a strong period of equity performance lasting at least a couple of months. I'm expecting the summer high to be put in somewhere between June and August, so that fits well with my view:

I've had a couple of requests to give my longer term view on gold, and I haven't finished charting that up yet, but I thought I'd post my medium term view for the rise since last summer, where there is a very nice setup on the daily chart. Gold hit support last week and a break below 1410 would be bearish, indicating towards support in the 1360-70 area. However the overall setup looks bullish to me, and a break with confidence of the strong resistance trendline now in the 1450 area would be extremely bullish. I'm inclined to interpret this setup as a continuation IHS, though I know many regard IHS patterns as being reversal patterns only. I disagree, and I'll post some classic examples of continuation IHSes in a weekend post when I have time. One of those of course will be the one on gold with the neckline in the 1000 area that has played out to target over the last couple of years. Looking at the negative divergence on the daily RSI there is some reason for caution on gold, and it is probably worth waiting for the resistance break before playing this pattern:

I was planning a weekend post on the complex EURUSD technical situation, and though I charted it up, I didn't finish writing the post in time. I'm planning to wrap that up and post it tonight before I have to redo the charts, but here's one of the charts to illustrate the important resistance level on EURUSD that we have almost reached. There are good arguments for both a reversal here and a major resistance break, but currently I'm leaning towards a short term reversal. That resistance level is in the 1.428 – 1.43 area:
I'm leaning bullish today. I think there's unfinished short term business on the upside even if wave 1 from the March low is winding down. Copper looks bullish short term, it's Monday and it's the most bullish month of the year historically. Altogether I'm thinking that equities may well just gap and go today.
The Gap Guy advises that fading gaps on the second day of the month is riskier than normal, though I would add to that that the second day of the month has not been more than modestly bullish statistically since the March 2009 low. That modest average masks substantial variability, but the only two big down days in the series so far have been during significant corrective waves in July 2009 and May 2010.
