First thing to mention is that I am still using the June e-mini contracts for charting rather than the Sept contracts. I'm planning to switch over tomorrow.
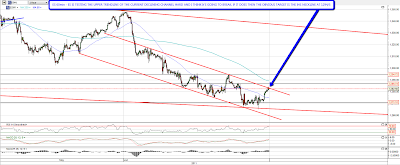
Overnight ES has rallied to test resistance on the tight declining channel that I posted yesterday. There have been a couple of pinocchios through the resistance trendline overnight and on balance I'm expecting resistance to break later with a likely rally target at a potential IHS neckline in the 1294/5 area:
NQ has broken up from the tight declining channel there and I'm expecting a move to another potential IHS neckline at 2267:

TF has broken up from both the falling wedge that I posted yesterday and the possible alternate declining channel I was looking at, and I'm seeing a likely upside target there at another potential IHS neckline at 796.8:
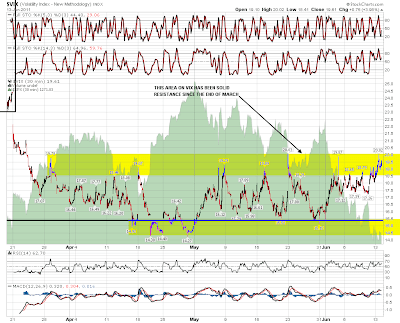
The obvious question here is whether I think we have seen a major low on equities, and the answer to that is no, but I think we're into the bottoming process now. I'm seeing this as wave 4 retracement before the real low and I am looking for potential reversal IHSes to start to form. There was definite positive divergence on the 60min RSIs yesterday at the lows, and the Vix is also very much in the right area to see some retracement here:
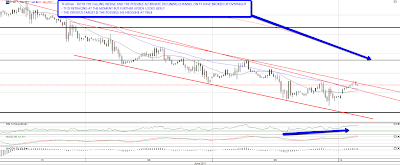
EURUSD has reached the 1.445 area that I was talking about yesterday as the likely high if EUR is putting in a right shoulder, but I noticed yesterday that there is also a declining channel in play which might see EUR rise to the 1.456 area. I've marked up both options on the 60min chart:

I've posted the TLT chart a few times over the last week talking about the possibility that TLT is putting in a short term high:
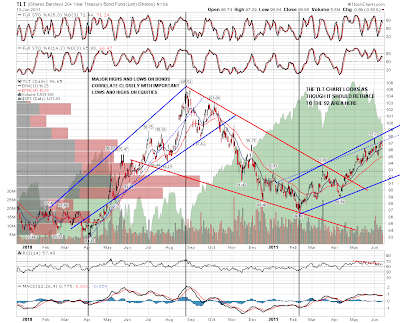
Looking at the 30yr treasury futures I'm seeing what looks like a rounding top in progress that would support the idea of a retracement on TLT. If there's another move down coming on equities however then there may be another last move up on both as part of this topping process:

The last chart for today is gold, to show where I think it is headed over the traditionally weak (for PMs) summer months. My broadening ascending wedge on gold has been somewhat messed up by stockcharts recently removing all intraday data for most commodities, but the real support level to watch on gold in any case is the 150 day SMA, which has acted as support four times since the last time gold dipped below it in late 2008 / early 2009. If we're going to see a decent retracement on gold this summer then that should be the target in the 1430-50 area:

I'm leaning towards seeing more upside on equities today, possibly after a partial gap fill. I'm seeing short term support on ES at 1278/9.
