It's a shame that I'm not trading much this week as I've really been nailing it the last few days. ES fell heavily in a trend day down and isn't far off the 1245-50 target I gave in my morning post yesterday. Here's how that broadening descending wedge is looking now:

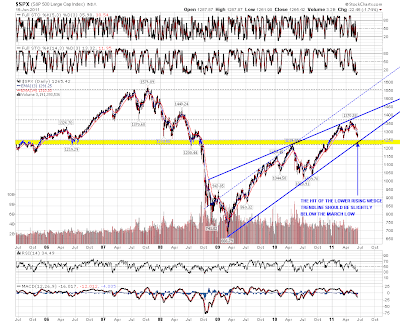
On the bigger picture SPX is approaching rising support for the bull market rising wedge (and possible rising channel), which is within the larger strong support zone between 1220 and 1250. A fairly exact hit of this support trendline is important, as the trendline has only two touches so far and really needs three to confirm it. I'm not expecting a move below it. A move below 1219 would most likely signal the end of this bull market, but even if we are to see that this year, I'm expecting to see a strong bounce from this support zone first:
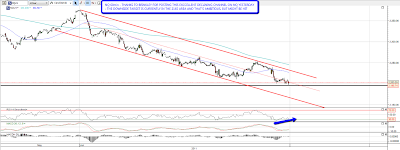
On NQ Brinkley at BlueChipBulldog posted a very nice looking declining channel yesterday which I have incorporated into my chart:
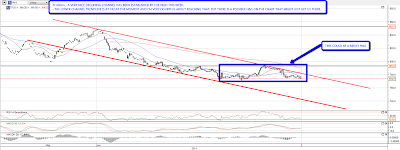
On TF the high this week has confirmed a matching declining channel on TF. The lower channel trendline is currently at 742, which looks overambitious, but a break of the upper channel trendline should at the least be confirmation that this down move is over as and when we see it. Two other things worth mentioning on the TF are the possible (but sloppy) continuation H&S that would target 753 if it plays out, and that as yet TF has not made a new low for this week, and is therefore not confirming the new lows on ES and NQ:
Vix broke up out of the 11 week range yesterday which is excellent news. I mentioned a few days ago that we should really see a break up on Vix before we saw a real low made and Vix is now out of both the range and the daily bollinger bands. I've marked up the two open gaps above from March as the obvious targets for this breakout:

EURUSD broke the H&S neckline yesterday morning and has made it over halfway to the 1.39 target already:
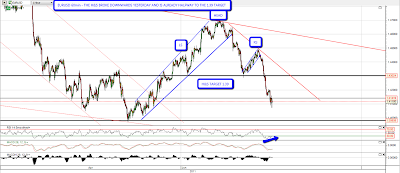
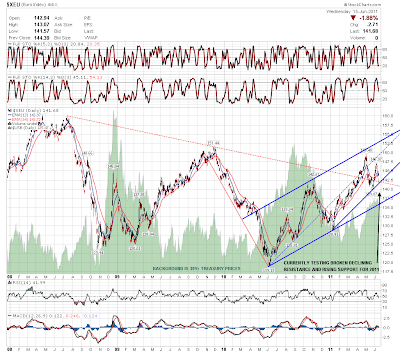
There is some support at the current level though, and I've marked that up on the XEU daily chart. There's a double trendline test here with rising support from the Jan 2011 low, and a retest of broken declining resistance from the 2008 high:
I have a slight problem today as there are so many interesting charts this morning. Anything over seven charts posted and Tim starts muttering darkly about posts that can be seen from space, so I'll just post the other two charts as links. The first chart is the oil chart, where the open gap support zone was filled yesterday, and the ugly H&S is now fully formed. On a break of 94 I'll be looking for a move to some big support trendlines in the mid-80s & the chart is here. Copper reversed where I was suggesting it should yesterday and I have downside targets at 400 and 395. The copper chart is here.
After a trend day down we normally see some retracement and that's what I've been expecting to see today, though apart from some positive divergence on the 60min RSIs, there's little sign of that so far. If we do see that retracement today then ES could hit the wedge support trendline in the 1240-3 area tomorrow, which should deliver the exact hit of SPX rising wedge support that I'm looking for. We'll see how that goes today.
