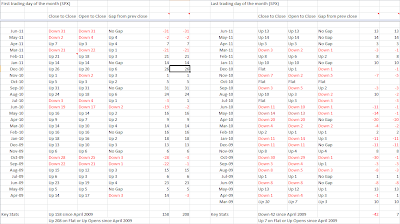
I've posted the stats for the first and last days of the month a few times, but there's more to this story than I've posted, as I've only posted stats since from March 2009 forward. The Stock Trader's Almanac has a page devoted to this phenomenon on the Dow between September 2 1997 and May 3 2010, and it states that over this period the Dow gained 3529.41 points, of which 5173.23 points were gained on the first day of each month. The remaining 3034 trading days combined therefore lost 1643.82 points over this period which is amazing.
The first trading day of the month's performance has been less remarkable since March 2009 on SPX, but they have still clocked up an impressive 158 points on a close to close basis, rising to 208 points if you had sold at the open on a gap down. That said, the last four months have seen three down closes of four, with losses of 31 and 21 in June and March respectively, neither of which started the day with a gap down. The first day of the month is down 12 points in total so far over 2011. Here are the stats for the first and last days of the month since March 2009:
Having said that, we are now seeing key levels reached on multiple charts and there is every reason to expect an imminent correction or consolidation. SPX has now gone well over the top of the upper bollinger band and slightly over the daily 50 SMA at 1317.10. The only other time that SPX has gone much above the daily BBs since the start of 2010 was at the November 2011 high, which marked a significant top before a 54 point correction. You can see that here on the SPX chart I posted yesterday. Vix has also touched the lower daily bollinger band there on both of the last two days and you can see from my chart that that often marks a short term high:

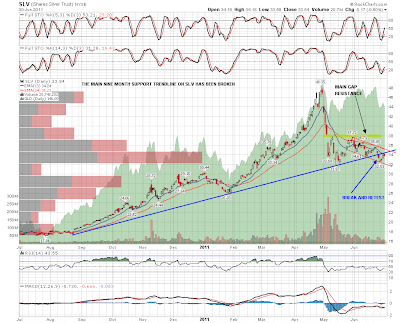
Of the equity-correlated instruments that I have posted this week, SLV has made my target for the retest of the broken trendline, though I've also marked in the little declining channel to show my secondary target if that breaks:
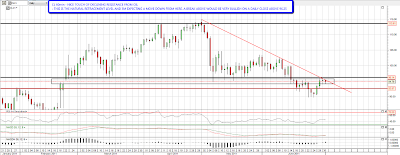
Oil has also made it to my declining resistance target and is still within my target 94-96 resistance zone. This is the natural reversal area for oil, and I'm expecting to see at least some retracement here:
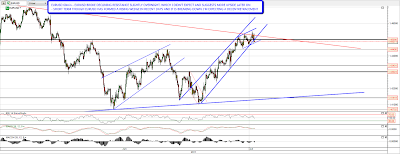
EURUSD hit my target declining resistance trendline exactly yesterday, but has spent some time trading above it overnight, which suggests more upside for EURUSD later. Short term however I have a decent rising wedge on EURUSD and it is breaking down. I have a much smaller rising channel for the last days or two and when that too breaks down I'm expecting to see some decent retracement of the big move up this week:
I've decided to do the SPX, NDX and RUT 30min charts today for a different view of these indices. First up is SPX where declining resistance from the high is being tested and the current four day move up is confined within a very tight rising channel. I've used EURUSD as the background to show the very tight correlation this week, which is worth bearing in mind if EURUSD reverses here:

The NDX chart is interesting. As with NQ there is an IHS on that chart, and the 2230 target was made yesterday, give or take a couple of points. NQ is over declining resistance from the high and there's a poor quality rising wedge there that's worth bearing in mind:

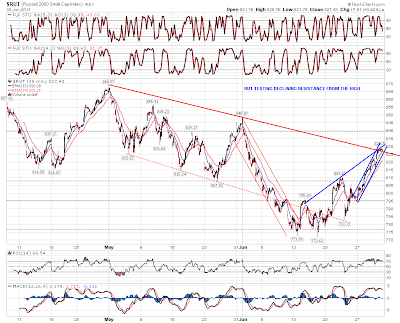
On RUT declining resistance from the high is being tested and as with SPX, has been penetrated slightly. There is another very tight up channel again like SPX:
The stats for the first trading day of the month are strongly bullish, albeit not for 2011 so far. I'm not expecting to see a big up day today, we might well see a consolidation or range day, and, particularly if EURUSD breaks short term support, there is a significant risk of a big down day today. If we don't see a significant retracement today then I'll expect to see that early next week. The ISM figures out at 10am EDT may be a significant market mover.
