Slope of Hope Blog Posts
Slope initially began as a blog, so this is where most of the website’s content resides. Here we have tens of thousands of posts dating back over a decade. These are listed in reverse chronological order. Click on any category icon below to see posts tagged with that particular subject, or click on a word in the category cloud on the right side of the screen for more specific choices.
Big Top Pee-Wee
At The Precipice (by Springheel Jack)
I've been bullish so far this summer regarding this move down, and I'm still bullish, though we're close to a level where I would switch my outlook to bearish, on the assumption that the cyclical bull market since March 2009 was over. There are some good reasons to think that it might be over, as QE is at an end for the moment and may not be restarted, and austerity is starting in the US, albeit hesitantly. I think the bears are right about the overall economic situation and I was reading an excellent article by Mohammed El-Erian this morning on the world debt crisis that I thought summed up the overall outlook for the next few years very well. Well worth a read regardless of your views here.
If we are going to see a reversal here then we are reaching the key decision area on SPX. The key target here, and where I am expecting to find some support, is at rising support from the March 2009 low within what is most likely a rising wedge, but possibly a rising channel.At the least, I am looking for a bounce off this support trendline and that should be in the 1270 SPX area:

Now in an ideal world we would see a bounce off that support trendline, and then a move to wedge resistance slightly north of 1400 before this cyclical bull market ended. If we just saw a bounce before another try at the trendline, or if it breaks now, then the pattern to watch is the H&S forming on the SPX daily chart:

I've been expecting this move down to end in at least a strong bounce, and in part that is because NDX has been outperforming SPX on the move down rather than leading the move down as I would expect if this move was going to do serious technical damage. You can see from my comparative indices chart that NDX has outperformed SPX strongly since the last peak and NDXE, the equal weighted NDX, has also outperfomed SPX:

Normally at the stage where we were about to see a reversal I would have decline channels or patterns that would breaking upwards to signal the area where the reversal would start. I had some of those at the close on Friday, but they broke up yesterday morning, and then broke down again, so they can't be relied upon now. I do have a broadening descending wedge on the RUT 15min, and a break above resistance there should signal a decent reversal:

Watching the NQ chart might give a signal that was faster or better however. There's no pattern to speak of on NQ now, but the range levels that I gave last week still look very solid. The range levels to watch are 2319 and 2352. 2350 broke yesterday, NQ then bounced near 2319 support and then retested 2352 resistance overnight. An hourly close above or below these current range levels will probably give us the direction of the next decent move in either direction:

Other charts that look interesting day include the Vix daily chart where the Vix closed back inside the daily bollinger bands yesterday, thereby triggering a Vix Buy Signal (for equities). That signal isn't worth much unless it is confirmed and the confirmation requires that Vix close lower again today. I'll be watching for that confirmation and if we get it that has been a solid reversal signal for at least a decent bounce shortly thereafter:

The last chart for today is the TLT chart. I've been posting the IHS on the ZB chart (30yr Treasury futures) for the last few days, but the TLT chart puts that move in better context in my view. The main points to note from the TLT chart are the big reversal IHS with the neckline at 92.6 that has now made target, and the perfect rising channel from the February low. Disregarding the short term continuation IHS with a target in the 101.9 area, the obvious target is the upper trendline of the rising channel in the 100.3 area. If we were to see a fast move to that target now, that would most likely be accompanied by SPX breaking the major support levels just below:

The senate is voting on the debt ceiling deal at lunchtime today, and if that vote goes badly then I think it's safe to say then main rising support at 1270 SPX will be broken. It is generally assumed that it will pass the Senate however, and if so, then there is an excellent chance of at least a decent bounce from here. I would like to see a touch of 1270 SPX during market hours to deliver a solid trendline bounce.
Hedging Against a Dollar Drop
Chafing at the world's reserve currency
After the excitement of the U.S. debt ceiling negotiations going down to the wire, Russian Prime Minister Vladimir Putin offered these comments about the U.S. and its dollar:
They are living like parasites off the global economy and their monopoly of the dollar.
[…]
If over there (in America) there is a systemic malfunction, this will affect everyone," Putin told the young Russians. "Countries like Russia and China hold a significant part of their reserves in American securities … There should be other reserve currencies.
With Putin's sentiments in mind, let's look at a way to hedge against a further drop in the dollar
Hedging the dollar
The steps below show how to hedge the dollar by buying optimal puts on the PowerShares DB USD Index (UUP) as a proxy for it. First a quick reminder about what optimal puts mean in this context.
About optimal puts
Optimal puts are the ones that will give you the level of protection you want at the lowest possible cost. As University of Maine finance professor Dr. Robert Strong, CFA has noted, picking the most economical puts can be a complicated task. With Portfolio Armor (available on the web and as an Apple iOS app), you just enter the symbol of the stock or ETF you're looking to hedge, the number of shares you own, and the maximum decline you're willing to risk (your threshold). Then the app uses an algorithm developed by a finance Ph.D to sort through and analyze all of the available puts for your position, scanning for the optimal ones.
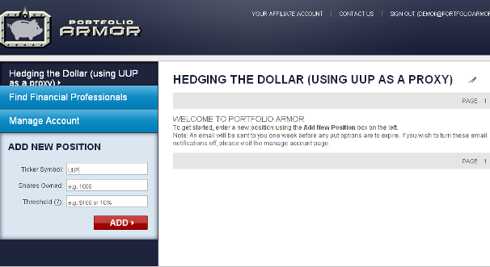
A step by step example
Step 1: Enter a ticker symbol
In this case, we're using UUP as a proxy for the dollar we've entered UUP in the Ticker Symbol field below.
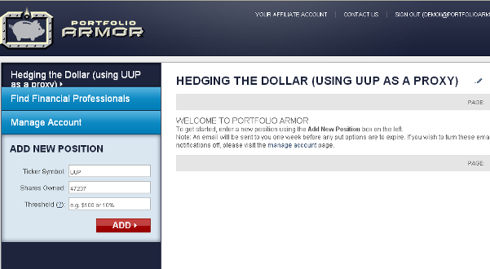
Step 2: Enter a number of shares
For the purposes of this example, let's assume an investor has a $1 million portfolio, all in dollar-denominated assets. So, since we're using UUP as a proxy, the number of shares we'll enter will be $1,000,000 / the most recent share price of UUP ($21.17, as of after hours Monday) = 47,236.7. We've rounded that up to 47,237 and entered that number in the "Shares Owned" field in the screen cap below.
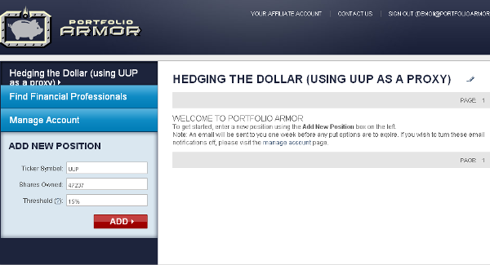
Step 3: Enter a decline threshold
You can enter any percentage you like for a threshold when using Portfolio Armor (the higher the percentage though, the greater the chance you will find optimal puts for your position). I've entered 15% in the "Threshold" field below.
Step 4: Click the red button
A moment after clicking the red button, you'd see the screen cap below, which shows the optimal put option contracts to buy to hedge against a >15% drop in UUP between now and March 16, 2012. The cost of this protection on a $1 million position would be $6,608, or about 0.66% of the position value.1, 2
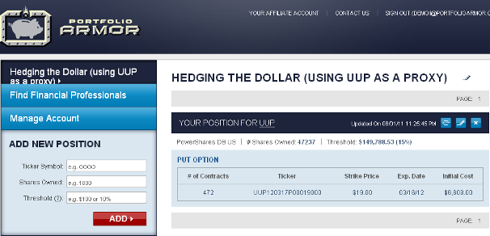
1Note that, in this case, Portfolio Armor rounded down the number of shares of UUP we entered to the nearest hundred (since one put option contract represents the right to sell one hundred shares of the underlying security), and then presented us with 472 of the put option contracts that would slightly over-hedge the 47,200 shares of UUP they cover, so that the total value of our 47,237 shares of UUP would be protected against a greater-than-15% decline.
2To be conservative, Portfolio Armor quoted that cost based on the ask price of the optimal puts. In practice, an investor can often purchase puts for a lower price, i.e., some price between the bid and the ask.
