Slope of Hope Blog Posts
Slope initially began as a blog, so this is where most of the website’s content resides. Here we have tens of thousands of posts dating back over a decade. These are listed in reverse chronological order. Click on any category icon below to see posts tagged with that particular subject, or click on a word in the category cloud on the right side of the screen for more specific choices.
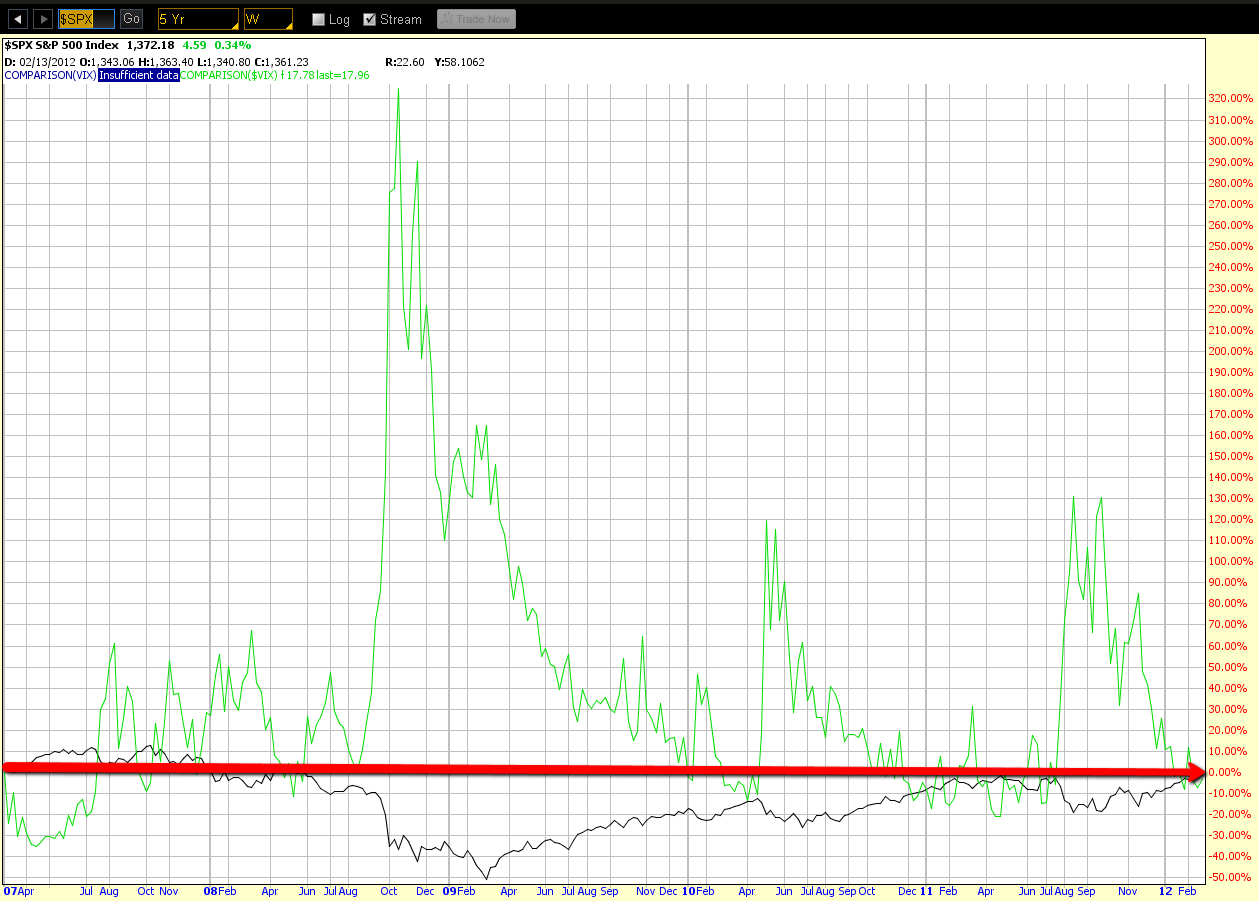
What Do The Complacency Odds Say?
The 5-Year Weekly chart below shows a comparison of the S&P 500 Index to the VIX. We can see what can happen when price has traded around the levels at which they are currently situated. On each of the past four years, price has spiked rather quickly from these levels by large percentages on the VIX, sending the S&P 500 plunging.
From the Ridiculous to the Sublime
Silver Breaks Up (by Springheel Jack)
Yet another boring day on equities yesterday with a spike down, low in the first hour and then a grind up for the rest of the day. What were the odds of that? My broken support trendline on SPX from the Dec 19th low crossed the resistance trendline yesterday so I'll now disregard it. Strong rising resistance in the 1378/9 SPX area today:

