Slope of Hope Blog Posts

Slope initially began as a blog, so this is where most of the website’s content resides. Here we have tens of thousands of posts dating back over a decade. These are listed in reverse chronological order. Click on any category icon below to see posts tagged with that particular subject, or click on a word in the category cloud on the right side of the screen for more specific choices.

Possible Bull Breaks (by Springheel Jack)

By -

We saw some big moves last week on the basis of talk by Draghi, backed up by Merkel, that the ECB would take whatever action necessary to save the Euro. Talk is cheap though and Merkel hasn't yet confirmed that she will accept the ECB printing money to save sovereign EU nations in trouble. I suspect she won't, and unless she does this move doesn't look likely to last long. Be that as it may some interesting things happened from a technical perspective last week so we'll go through those. 

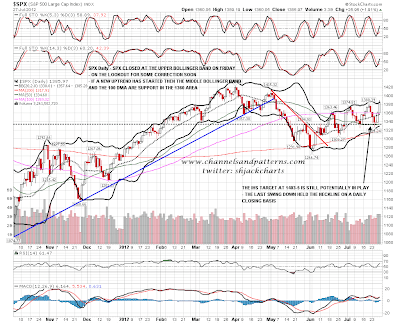
On the SPX daily chart the SPX closed at the upper bollinger band on Friday. This is an obvious time to look for some retracement though I note the overnight action on ES looks like a bull flag so far. If a new uptrend has started then there should now be strong support in the middle bollinger band and 100 DMA area around 1360:

(more…)

The Highs are in Sight

By -

Hell of a week, eh folks?  Being patient with this range the past month has been challenging, but we knew that sooner or later it would eventually break. 

I was fairly doubtful that we would break to the upside, but I learned my lesson in the first quarter of this year, that no matter how bad things look or feel, you have to HAVE TO wait for a support level to break before getting committed to the downside. 

For me, SPX 1325 was that level to watch.  I closed a few shorts that day as a precaution, after all, I could always get short again if the level broke.  Now that we have in fact broken upwards, it appears my observation last month is still in play. 

To summarize, I was expecting a 50-61.2% retracement (small blue box) followed by a return to the Mar/April highs.  You can read it here if you want a reminder.

(more…)

Money Flow for July Week Four

By -

Further to my last weekly market update, this week's update will look at the Major Indices and Major Sectors to assess strength vs. weakness in these groups during the past week.

The Weekly chartgrid below of the YM, ES, NQ and TF shows that price has been locked in a tight upward-sloping trading range from their June lows, with market action see-sawing back and forth each week.

This is the first week since that time that all four E-mini Futures Indices have closed above the mid-Bollinger Band (for today's exercise, I'll refer to this point as their "mean" on the Weekly timeframe). All four closed near their weekly high.

(more…)