Slope of Hope Blog Posts

Slope initially began as a blog, so this is where most of the website’s content resides. Here we have tens of thousands of posts dating back over a decade. These are listed in reverse chronological order. Click on any category icon below to see posts tagged with that particular subject, or click on a word in the category cloud on the right side of the screen for more specific choices.

Climate Change (by BKudla)

By -

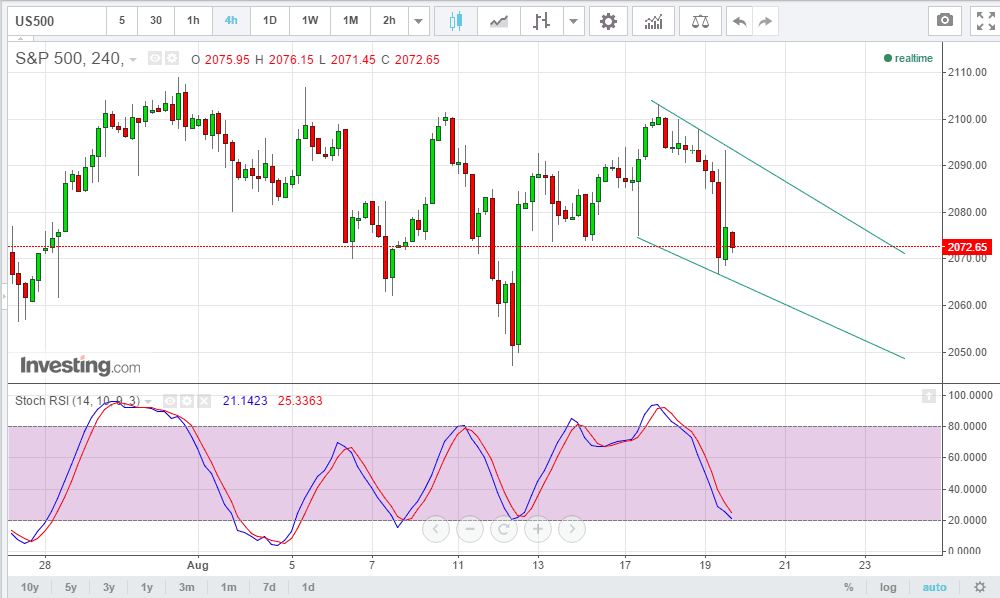
My preferred time frame to check market direction is the four chart. I attached a chart for your reference. Also I only care about momentum, and trendlines to guide me.

As you can see, this gives me a good framework to determine my bullish or bearish leanings.

Yesterday and today, I was watching for a bearish swing after the 2100 area failed, and with momentum receding. We got it, in spades. I then extended the trendlines to let me know when to abandon this bearish tilt, and watched as the market traded up to the downtrend line, and failed, and momentum rolled over at the same time a four hour crossed over, and went short.

2015-08-19_1324

I then covered expecting a end of the day ramp, so traded on the five minute signal, and saw that momentum was waning and went short again, right at the close, (79.50).

That is just a preamble for the set up. Now that we failed, I will now watch for the bottom trendline for a failure of that trendline. I am reasonably confident it will fail, as when momentum goes below 20, it gets stuck on sold until momentum fights back above. My view is we are going to test support at the August low. Then will watch the July low.

My mind changes at a move above 20 on momentum, and / or a break above the upper trendline.

I keep it as simple as this. Enjoy.

Looking for Lower Levels Ahead Final Wave Up in USD/CAD

By -

The May 14th low in the USD/CAD counts best as the bottom of a large degree wave 4. The rally that we have seen that made a local top on August 4th counts as a very clear 3 wave structure so far. This leaves us looking for another high to complete our wave five wave structure off of the May 14th low.

Now while the pattern certainly does suggest that we should see new highs into the later part of the year the overall structure of the pattern ideally should see lower levels before heading higher into the final wave ((v)) up. These lower support levels currently come in at 1.2956 – 1.2770 which is shown on the chart in the form of a blue box, this is our buy zone. As long as we remain over the lower support level of 1.2770 then the probabilities are good that we will see new highs into the 1.3414 level with possible extensions into the 1.3688 level, these are our sell zones. Should we break under the 1.2770 level the count will still remain valid, however the probabilities of seeing follow-through to the upside under this count are reduced. A break under the 1.2563 level would invalidate this count and suggest that we may have made a more complex top on August 4th. This is the level that we would stop out of our trade.

(more…)