Browse Stacks: Patterns: Trendlines: slopechart_CROX.jpg

slopechart_CROX.jpg

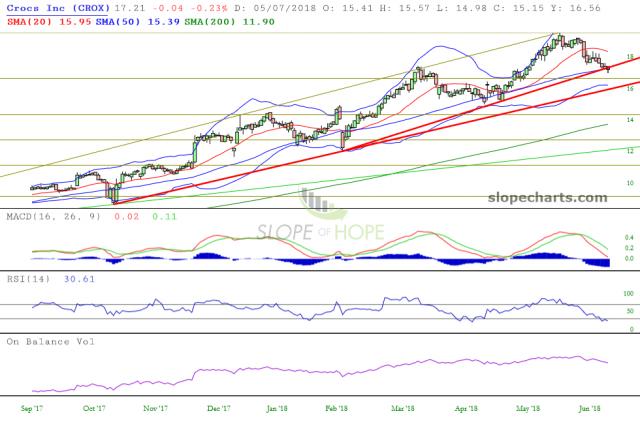
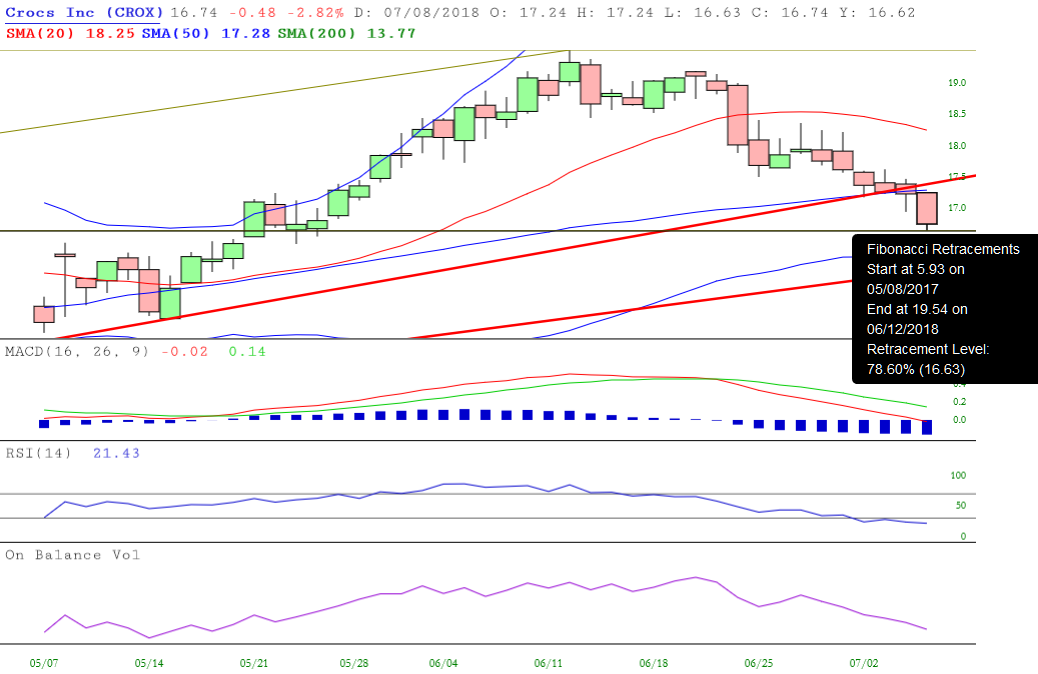
$CROX appears to have broken a steep trendline and could be moving down to a less steep trendline. At the very least down to the nearest Fibonacci level at 16.63ish.

Image added via SlopeCharts
slopechart_CROX.jpg

Comments

ClawsClaws
Why can't I increase the size of the chart when I click on the one above? @TimKnight 7/5/18
ZeroPointMind ΦZeroPointMind Φ
I can't either. Usually when you hover over a stacked image the mouse pointer becomes a hand indicating it is clickable. Did you stack it or add it to comments ? 7/5/18
NorthyNorthy
I stacked it. 7/5/18
ZeroPointMind ΦZeroPointMind Φ
I got this when I posted the comment above 
----------------------------------------------------- 
{"success":true,"html":"ZeroPointMind \u03a6<\/span><\/a><\/div>I can't either. Usually when you hover over a stacked image the mouse pointer becomes a hand indicating it is clickable. Did you stack it or add it to comments ? moments ago<\/span><\/div>"} 7/5/18
NorthyNorthy
Yes, yes I did. But to be fair. Credit where credit is due. So did Fibonacci. 
 
7/6/18
ClawsClaws
Oh this is weird. Northy's avatar is taking over again. 7/6/18
...