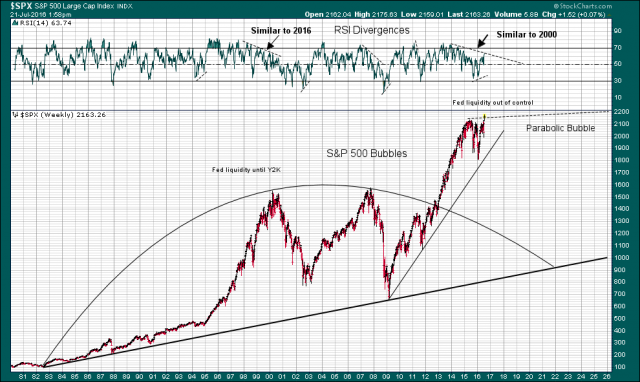
@Silver_Singu: Why don't you like trendlines on arithmetic charts? You don't think it interesting that if you connect the lines from 1982, 1984, 1985, and 1987, that you get a cross at exactly where the 2009 low was? Coincidence? Those using log-charts were left completely in the dark as to why the 2009 bottom happened where it did, while those of us using linear charts were not only expecting the bottom, but preparing for it ; 7/22/16
I didn't want to say that it isn't interesting but that most people who are drawing trendlines in linear charts don't know what they really are drawing. I only hope you know 7/24/16
 Pointefarie


