Users: Violet: slopechart_ZION.jpg

slopechart_ZION.jpg

Weekly chart of ZION. 
What do you see?

Image added via SlopeCharts
slopechart_ZION.jpg

Comments

VioletViolet
1/5/23
Mr. WizardMr. Wizard
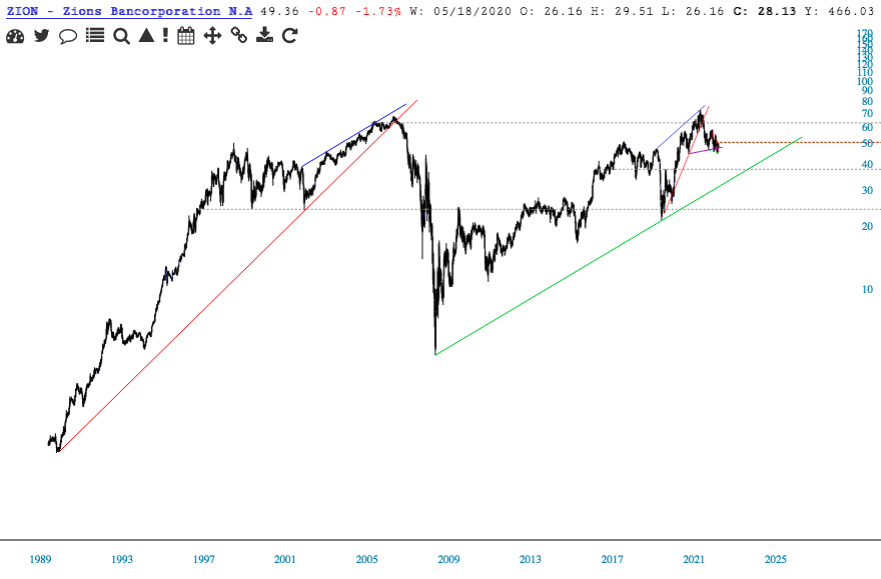
I see a falling triangle. I also see a small badly formed HnS, which in this case would be a continuation pattern calling for more downside. 
The larger chart shows a bigger HnS also calling for more downside. 1/5/23
GonnabesickGonnabesick
The 2nd chart could be an expiring B-wave up from the bottom of the green TL. If so, would expect to revisit that low . . . 
In the meantime, the double top argues for a test of the green line. 1/5/23
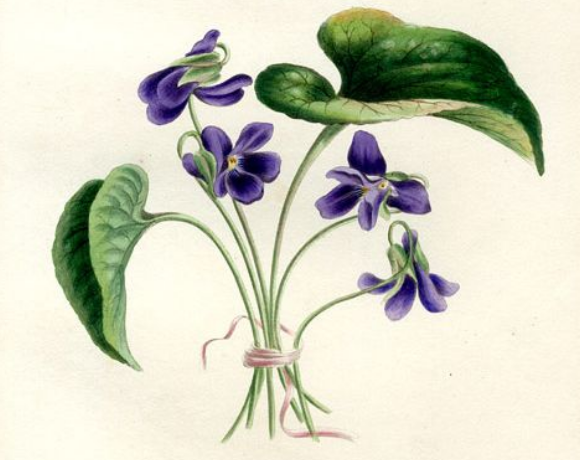
VioletViolet
Guess I need my eyes checked. I don't see the h&s as badly formed. 1/5/23
DCBDCB
I see support at 47.50 area. 1/5/23
DCBDCB
And price below a falling 200ma. 1/5/23
Andyjackson1Andyjackson1
@Violet what do I see? a shitty bank. 1/5/23
VioletViolet
Appreciate everyone's feedback. 
Interesting that my question was asked kinda-sorta rhetorically, as that's how obvious I saw the h&s. 
 
1/5/23
VioletViolet
Andy - Good Answer! 1/5/23
...