View: the ELLIOTT WAVE lives on | OEW: an Objective approach to the Elli...
the ELLIOTT WAVE lives on | OEW: an Objective approach to the Elli...
REVIEW
This week the US market was just moving along as it has been in recent weeks. Extending the uptrend and making all time new highs nearly every day. On Wednesday, when FED chairman Bernanke was reading his prepared report to congress, regarding the economy. The market hit an all time new high at SPX 1687. When the question and answer session began market pundits got hint of a potential tapering off in the QE 3 program. Pundits took that hint and started to take profits. For the week the SPX/DOW were -0.7%, the NDX/NAZ were -1.2%, and the DJ World index lost 1.4%. Economic reports for the week were upbeat with positive reports outpacing negatives one 6 to 2. On the downtick: the M1 multiplier and the WLEI. On the uptick: existing/new homes sales, new home prices, the FHFA housing index, durable goods orders and weekly jobless claims improved. Next week, holiday shortened, we get reports on Q1 GDP, Personal income/spending, PCE prices and Consumer sentiment. Best to your weekend, holiday, and week.
LONG TERM: bull market
It was a busy week for the markets and the OEW group alike. We posted several special reports during the week, and have one left which we will post this weekend. This should bring everyone up to date on the general consensus in the group. In case you missed any or all of them here is a link recap:
http://caldaro.wordpress.com/2013/05/16/international-equity-markets/
http://caldaro.wordpress.com/2013/05/19/commodity-bear-market/
http://caldaro.wordpress.com/2013/05/20/the-feds-monetary-base-update/
http://caldaro.wordpress.com/2013/05/21/currencies-update/
http://caldaro.wordpress.com/2013/05/22/an-oew-bull-market-analysisprojection/
If you invest only in the US stock market you may find all, some, and possibly none of them useful. The exception should be the last report. There you will find a chart, in simplified OEW terms, on what to expect for the rest of the bull market. For those more technically inclined we offer the following explanation.
We continue to track the waves of this bull market as Cycle [1] of a new Super cycle multi-decade bull market. This very long term bull market should be comparable to the 1932-2007 Super cycle bull market. Super cycle bull markets unfold in five Cycle waves, and we are currently in its first bull market from the Super cycle low in March 2009.
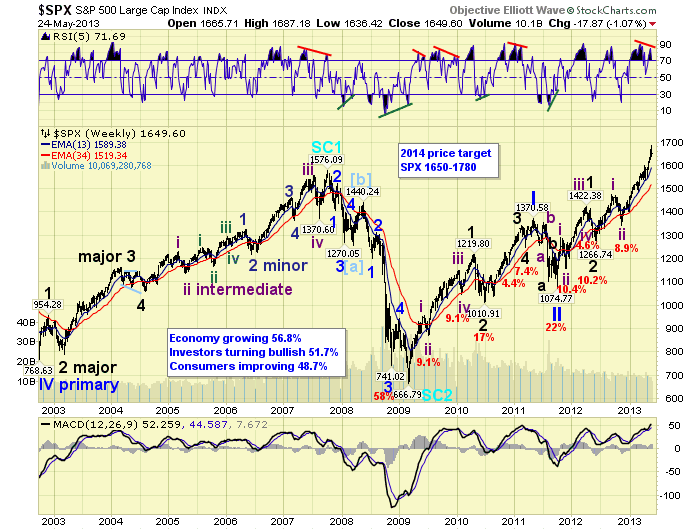
Cycle wave bull markets unfold in five Primary waves. Primary waves I and II completed in 2011, and Primary III has been underway since then. Primary wave I divided into five Major waves with a subdividing Major wave 1. Primary III is also dividing into five Major waves, but both Major waves 1 and 3 have been subdividing. Major waves 1 and 2 completed by mid-2012, Major wave 3 has been underway since then. Intermediate waves i and ii completed in late-2012, Intermediate wave iii, our current uptrend, has been underway since then.
Before this bull market ends we expect Intermediate waves iii, iv and v to complete ending Major wave 3. Then a Major wave 4 correction will lead to a Major 5 rally to complete Primary III. Then after a Primary IV correction another uptrend to complete Primary V and the bull market. Currently we expect a bull market peak between SPX 1650 and 1780 in late-winter to early-spring of 2014.
MEDIUM TERM: uptrend hits SPX 1687
We have been counting this, six month Intermediate wave iii, uptrend unfolding in five Minor waves: Minor 1 SPX 1424, Minor 2 SPX 1398, Minor 3 SPX 1597, Minor 4 SPX 1536 and Minor 5 SPX 1687 thus far. Minor 1 was simple, Minor 3 extended into five Minute waves, and Minor 5 is extending as well. Minor 1 rose 81 points, Minor 3 rose 199 points, and Minor 5 has risen 151 points thus far. Overall this uptrend has risen 344 points. Making it the largest point gaining uptrend of the entire bull market.
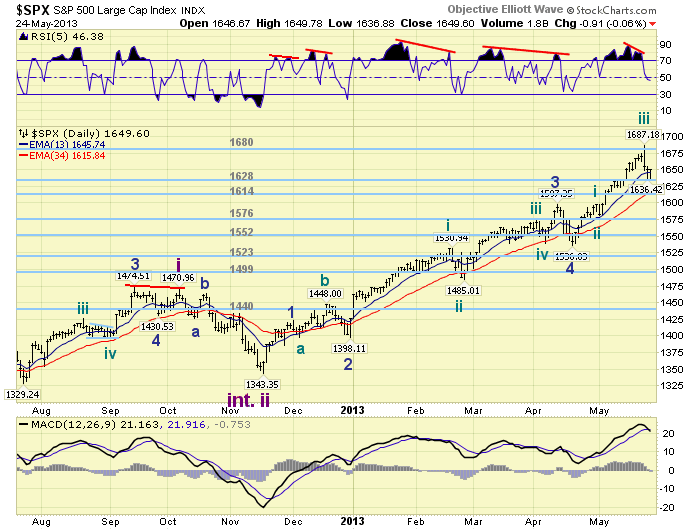
At the recent high Intermediate wave iii is equal to 1.618 times Intermediate wave i. A very common Fibonacci wave relationship of one wave to another within the same degree. With negative divergences on the weekly, daily and hourly timeframes, the recent high should normally be considered the end of the uptrend. And, we do have a short term count that fits this scenario in Minute waves: 1598-1581-1673-1663-1687. The only problem we have with this count is that the fourth wave at SPX 1663 appears to be too shallow for this wave structure.
Had that decline dropped into the SPX 1640′s, and then rallied to 1687 it would be a better fit. Nevertheless, it is worthwhile to note that the uptrend high may have already occurred. For now we will keep the short term count posted as is. Expecting a retest of the highs, or higher, before the uptrend ends. Keep in mind, however, waiting for a fifth of a fifth wave to sell is often not advisable. Medium term support is at the 1628 and 1614 pivots, with resistance at the 1680 and 1699 pivots.
SHORT TERM
Our preferred count remains Minute waves: 1598-1581-1687-1636/37-with the fifth wave next. If the market can now rally above SPX 1653, this would turn our short term OEW charts positive, suggesting Minute v is underway. Then a retest of the high or the OEW 1699 pivot would be next. Should this market start making lower lows, reaching the OEW 1628 pivot, and breaking below its lower range: SPX 1621. Then the uptrend probably topped at SPX 1687, and the short term count posted in the Medium term section is correct.

Should a downtrend be underway we would expect it to last about one month and find support around the SPX 1540 level. This level would be right in between the OEW 1523 and 1552 pivots. Suggesting either one could act as support as well. Short term support is at the 1628 and 1614 pivots, with resistance at the SPX 1658-1667 range and the 1680 pivot. Short term momentum ended the week above neutral. The short term OEW charts remain negative with the reversal level at SPX 1653. Best to your weekend!
FOREIGN MARKETS
The Asian markets were mostly lower losing 1.8% on the week. Only S. Korea remains in a downtrend.
The European markets were all lower losing 3.0% on the week. All indices uptrending.
The Commodity equity group were mixed gaining 0.5% on the week. All uptrending.
The DJ World index is still uptrending but lost 1.4% on the week.
COMMODITIES
Bonds continue to downtrend losing 0.5% on the week.
Crude is still in a downtrend and lost 2.0% on the week.
Gold is downtrending as well but gained 2.0% on the week.
The USD is uptrending, but lost 0.8% on the week.
NEXT WEEK
Monday: holiday. Tuesday: Case-Shiller at 9:00, then Consumer confidence at 10:00. Thursday: Q1 GDP (est. +2.7%), weekly Jobless claims, and Pending home sales. Friday: Personal income/spending, PCE prices, the Chicago PMI and Consumer sentiment. The FED has nothing scheduled for the week. Best to your weekend, holiday and week!
Comments
 ALL KNOWING