Backtesting options helps you make better investment decisions by giving you the ability to test trading strategies using historical, real world performance information. This feature is available by way of the Platinum membership, which you can learn about here.
What is backtesting?
Backtesting is the process of reviewing a specific strategy or model based on the actual results if you had implemented it in the past. Backtesting is an important way for investors to try their models and assess the viability of an options trading strategy prior to making a real trade.
The basic theory for backtesting options is that historical performance is an indicator of future performance for a model with specific rules and parameters. Therefore, what worked well in the historical data is likely to work well in current and future trades. At the same time, if an option trading model or strategy did not work in the past it is unlikely to be effective in the future.
Using a model combined with historical data, traders and analysts can move forward with more confidence in how their strategy may perform in a real trading market.
How do you backtest options strategy?
Performing historical back-tests on options strategies is one of the most computing-intensive and complex tasks in the trading world. It is absolutely recommended to use a program to automate the calculations. Through the Options Backtest Page, the Slope website provides an easy-to-use method to execute what is, behind the scenes, an exceptionally complex task with daily options data going back to 2007.
To begin, create your backtesting options strategy with defined rules or conditions and then plug in the variables – the tool will do the work for you. There is really no limit to the possibilities with the Slope options strategy backtester. With the overall goal being to determine which tickers and strategies appear to have offered the best results using actual price data for as long a period of time as you like going back at least 10+ years.

Guide to Using the Slope Options Backtesting Tool
The first screen requires the entry of a ticker symbol and the choice of strategy. In fact, those are the only two things that are required to perform a backtest, although you can change other parameters. You can enter any U.S. stock or ETF symbol, or any common index symbol (like SPX for the S&P 500, for instance).
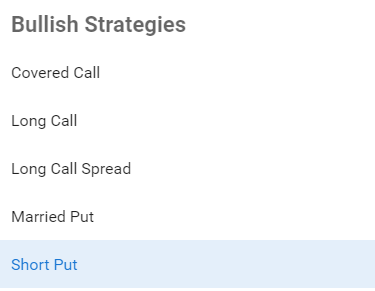
Initially, the strategy dropdown menu has bullish, bearish, and neutral strategies, but you can uncheck any boxes to reduce the list if you want to home in on a particular direction.

Once the ticker is entered, click on the Strategy dropdown, and the twenty-one available strategies are presented, grouped by categories. Choose any one backtesting options strategy whose historical performance you would like to test.
The start and end dates are automatically filled out, but you can change them if you like. The end date defaults to the present, but sometimes you might want to get longer-term historical backtests by making the start date earlier, which you can do by clicking inside the field and using the widget to quickly pick out the date you want.
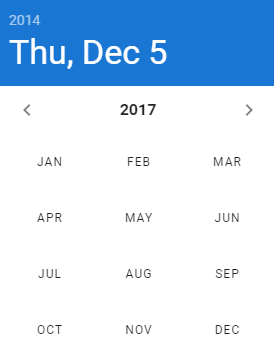
And, once you have settled on these dates, click the Next button.

The second screen doesn’t have to be changed at all before you run the backtest, but you can alter its parameters if you like.
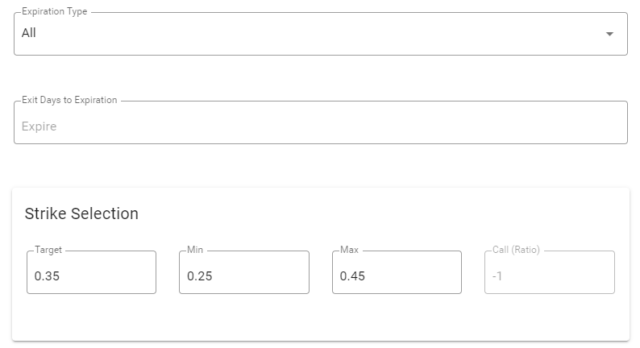
The first dropdown, Expiration Type, lets you choose whether you want to use Monthly options, Weekly options, or All (which is the default). The second field lets you define if the hypothetical options trades should be closed out a certain number of days before they expire (or, if unchanged, this field will simply hold the trade until the options expire).
Finally, the strike selection lets you define the delta value for any options chosen. With the default figures below, the system will target a delta value of 0.35 but will accept anything within a range of 0.25 to 0.45. These values define the strategy as being OTM (Out of The Money options) although you can change the values to any legitimate delta value.
You are now ready to run the backtest, which you invoke by clicking – – unsurprisingly – – the Run Backtest button. In a moment, a status information dialog box will appear. Do not be alarmed at how long the system grinds away at the analysis. It can take literally minutes to do complex computations, but the screen will keep you up to date as to its progress.

Once the servers have finished all the hard work, you will be dazzled with a smorgasbord of information for backtesting options. Here is just a portion of the summary results table:

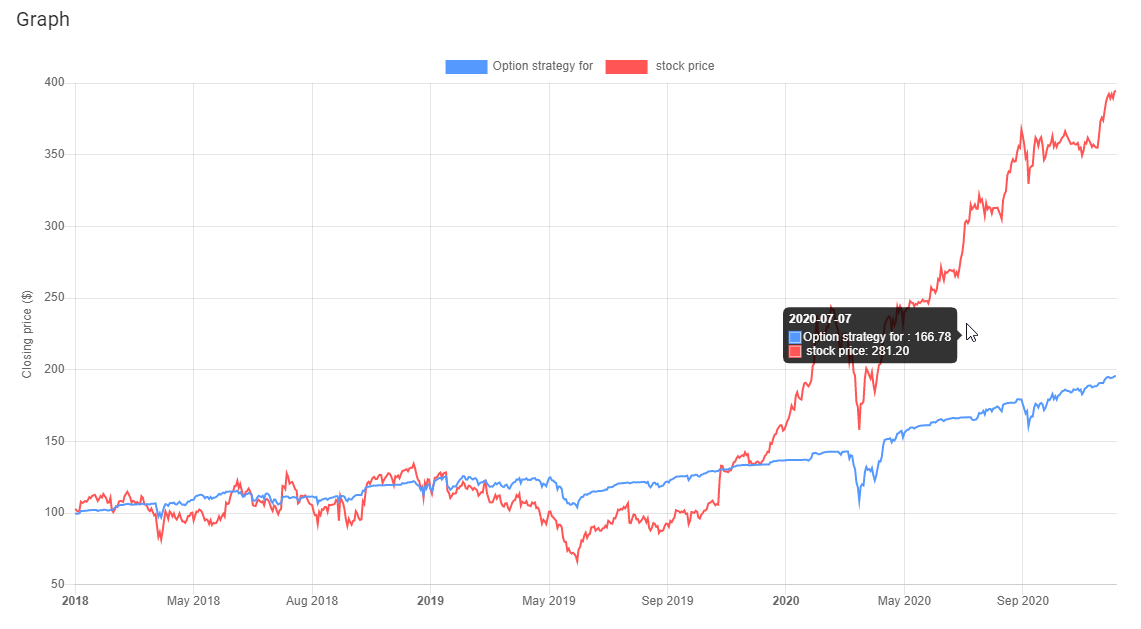
Beneath that is a graph showing the results of the strategy (in blue) versus the performance of the equity by itself (in red).
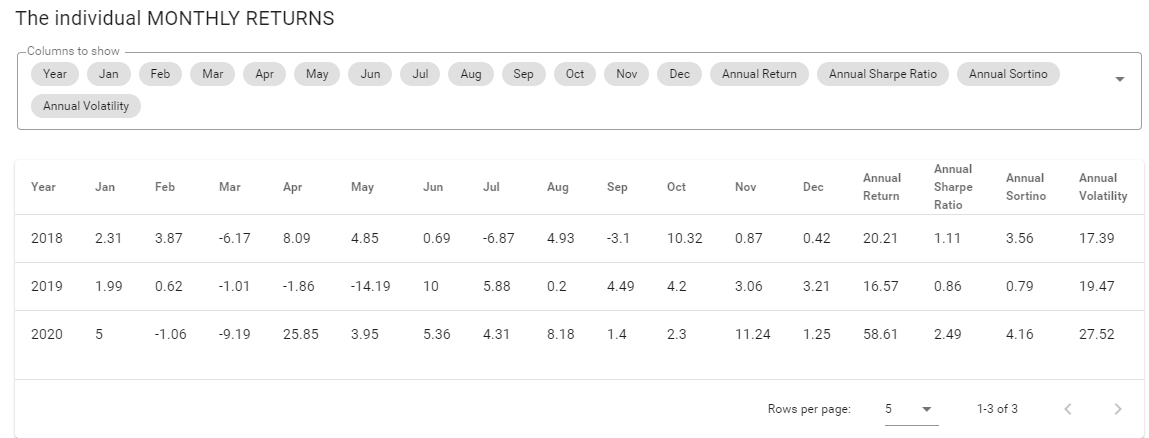
The vast amount of information is further broken down into a month-by-month summary of the strategy returns. Note that you can click on the dropdown (where the field names are shown) to check or uncheck any particular fields, in case there are some which do not interest you.
Beneath that is even greater detail, showing each and every trade comprising the entire strategy exercise.
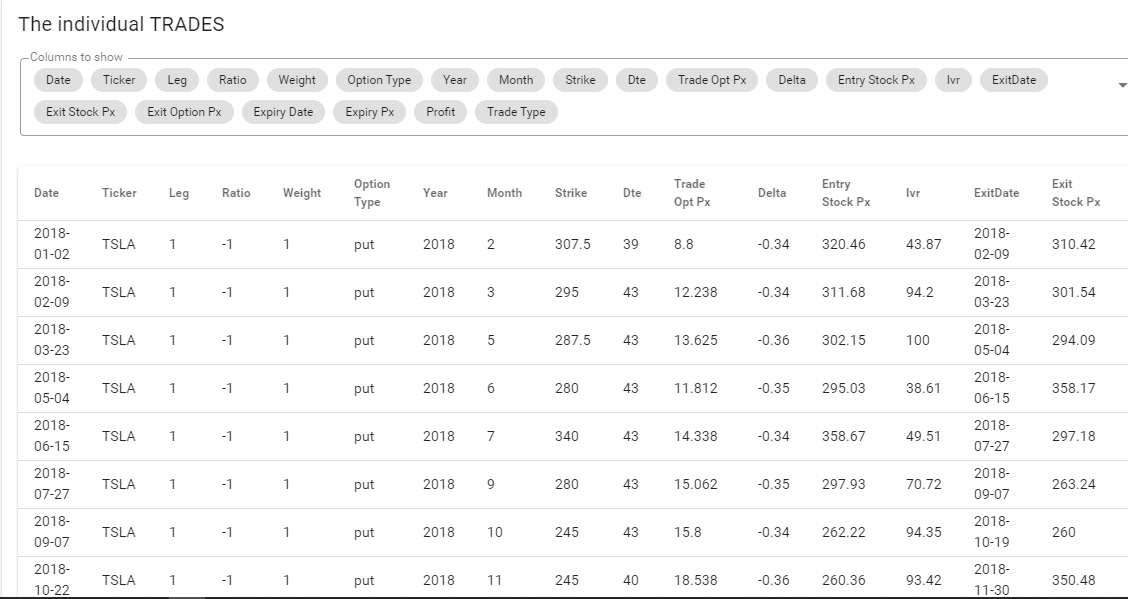
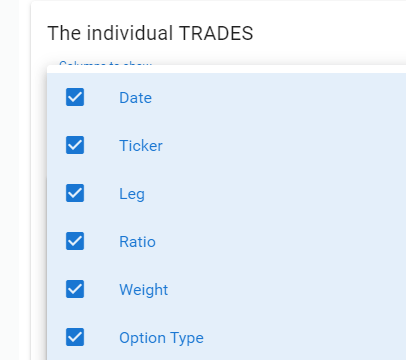
With this table, too, you can click on the “Columns to show” area and check or uncheck any particular field.
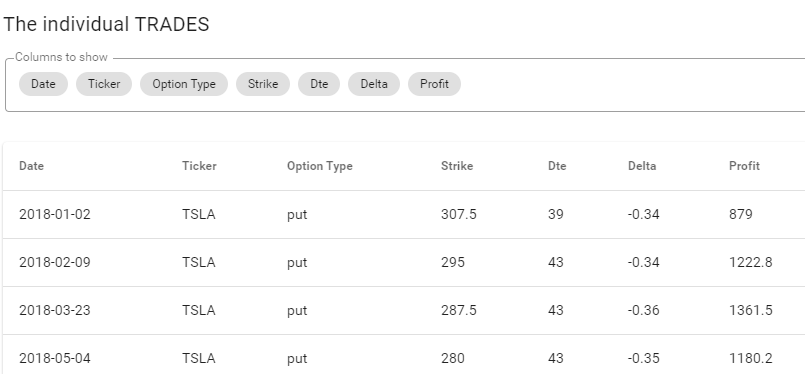
This way, as the example below illustrates, you can create a far more compact presentation of the results with extraneous information.
There is really no limit to the possibilities with the backtesting options strategies tool, with the overall goal being to determine which tickers and strategies appear to have offered the best results using actual price data for as long a period of time as you like.
If you would like to try a Platinum membership (cancel at any time) to use this feature, click here.
