Options are the most popular trading instrument among Slope of Hope users, so they are a core focus of this site. There are a number of services on Slope designed to help options traders in their exploration and analysis, such as:
- Backtesting
- Earnings Date Charts
- Idea Explorer
- IV Rank
- OptionDots
- Payoff Analyzer
- Price Cones
- Reaction Graphs
- Relative Rotational Graphs
- Options Strategy Guide
- Volatility Analysis
We also encourage you to check out TradeMachine Pro in order to generate actionable trading ideas. Slope readers get discount pricing, and you can learn more about this powerful product by clicking here.
In this guide, several commonly-used terms are as follows:
- Leg (one, two, etc.) – these are component parts of a given strategy. If a given trade requires the purchase of two options and the sale of another, that would involve three “legs” in the trade;
- Net Result (AKA Trade Price) – the cash received in your account (net credit) or cash paid out from your account (net debit) in total to execute the given strategy, assuming the minimal trade size was executed;
- Break-even – the price that the underlying security needs to be in order for the trade to show neither a profit nor a loss once the expiration date of the option arrives (some strategies have multiple break-even prices, since more than a single outcome can yield $0 change to your investment);
- Maximum Profit – the most profit a given trade could produce, assuming the smallest trade size was executed;
- Maximum Loss – the most loss a given trade could produce, assuming the smallest trade size was executed;
- Width (or “Spread”) – this is the price range from one strike price to another. For example, if one strike was 50 and the higher strike was 70, the width would be 20. There are instances, such as strategies with four legs, in which more than one spread needs to be considered when calculating the maximum profit or maximum loss.
It should be noted that none of these calculations take commissions into account. Considering how commissions seem to be approaching zero, this is becoming less relevant.
If there are other strategies or tools related to options that you would like to see on Slope, please contact us. Thank you!
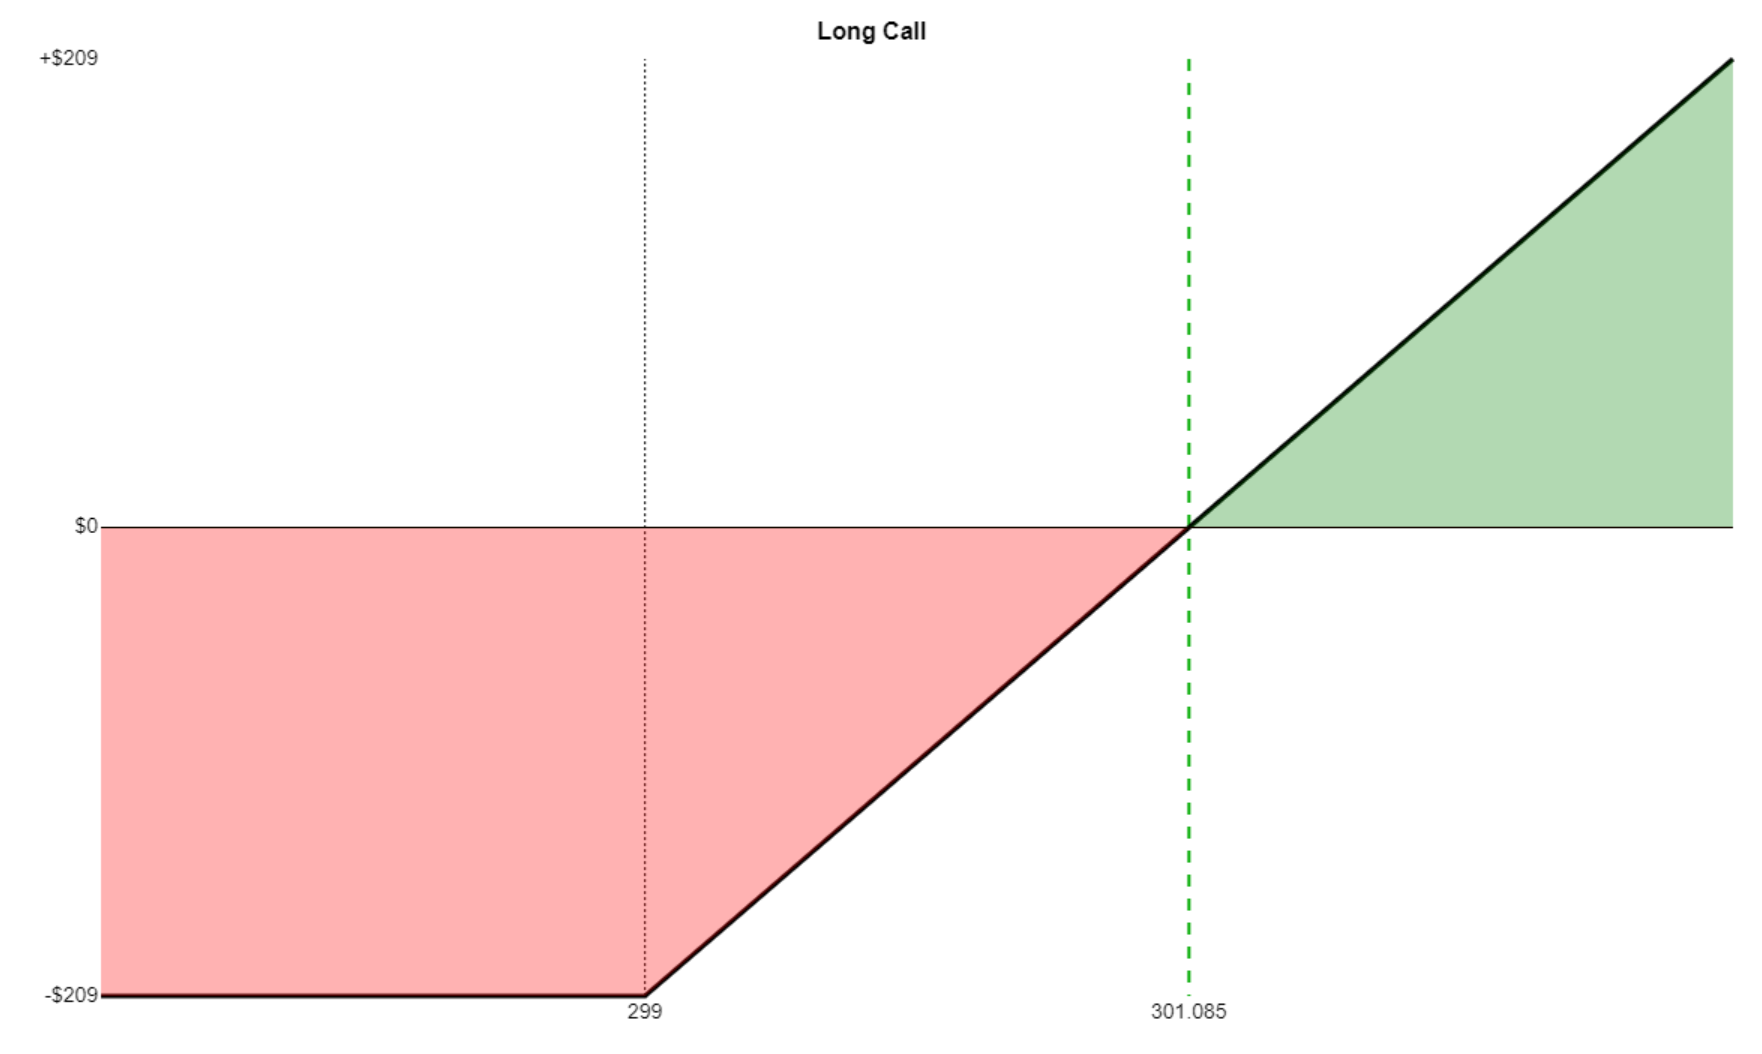
A long call position has these properties:
- Market View: Bullish;
- Opportunity: Unlimited;
- Risk: Predefined and limited;
- Leg One: Purchase of call;
- Net Result: Debit to your account;
- Break-even Price: Strike value plus debit paid;
- Maximum Profit: Unlimited;
- Maximum Loss: Debit paid
Simplistic Example Trade:
- Buy a $70 call at $5
- Net debit is $5
- Break-even price is 70 plus 5, which is 75
- Maximum profit is theoretically unlimited
- Maximum loss is the net debit of 5 times 100, which is $500 per contract
Here is an example Payoff Analysis of this strategy, which uses different figures:
A short call position has these properties:
- Market View: Bearish;
- Opportunity: Predefined and limited;
- Risk: Unlimited;
- Leg One: Sale of call;
- Net Result: Credit to your account;
- Break-even Price: Strike value plus premium received;
- Maximum Profit: Credit received;
- Maximum Loss: Unlimited
Simplistic Example Trade:
- Short a $70 call at $5
- Net credit is $5
- Break-even price is 70 plus 5, which is 75
- Maximum loss is theoretically unlimited
- Maximum profit is the net credit of 5 times 100, which is $500 per contract
Here is an example Payoff Analysis of this strategy, which uses different figures:
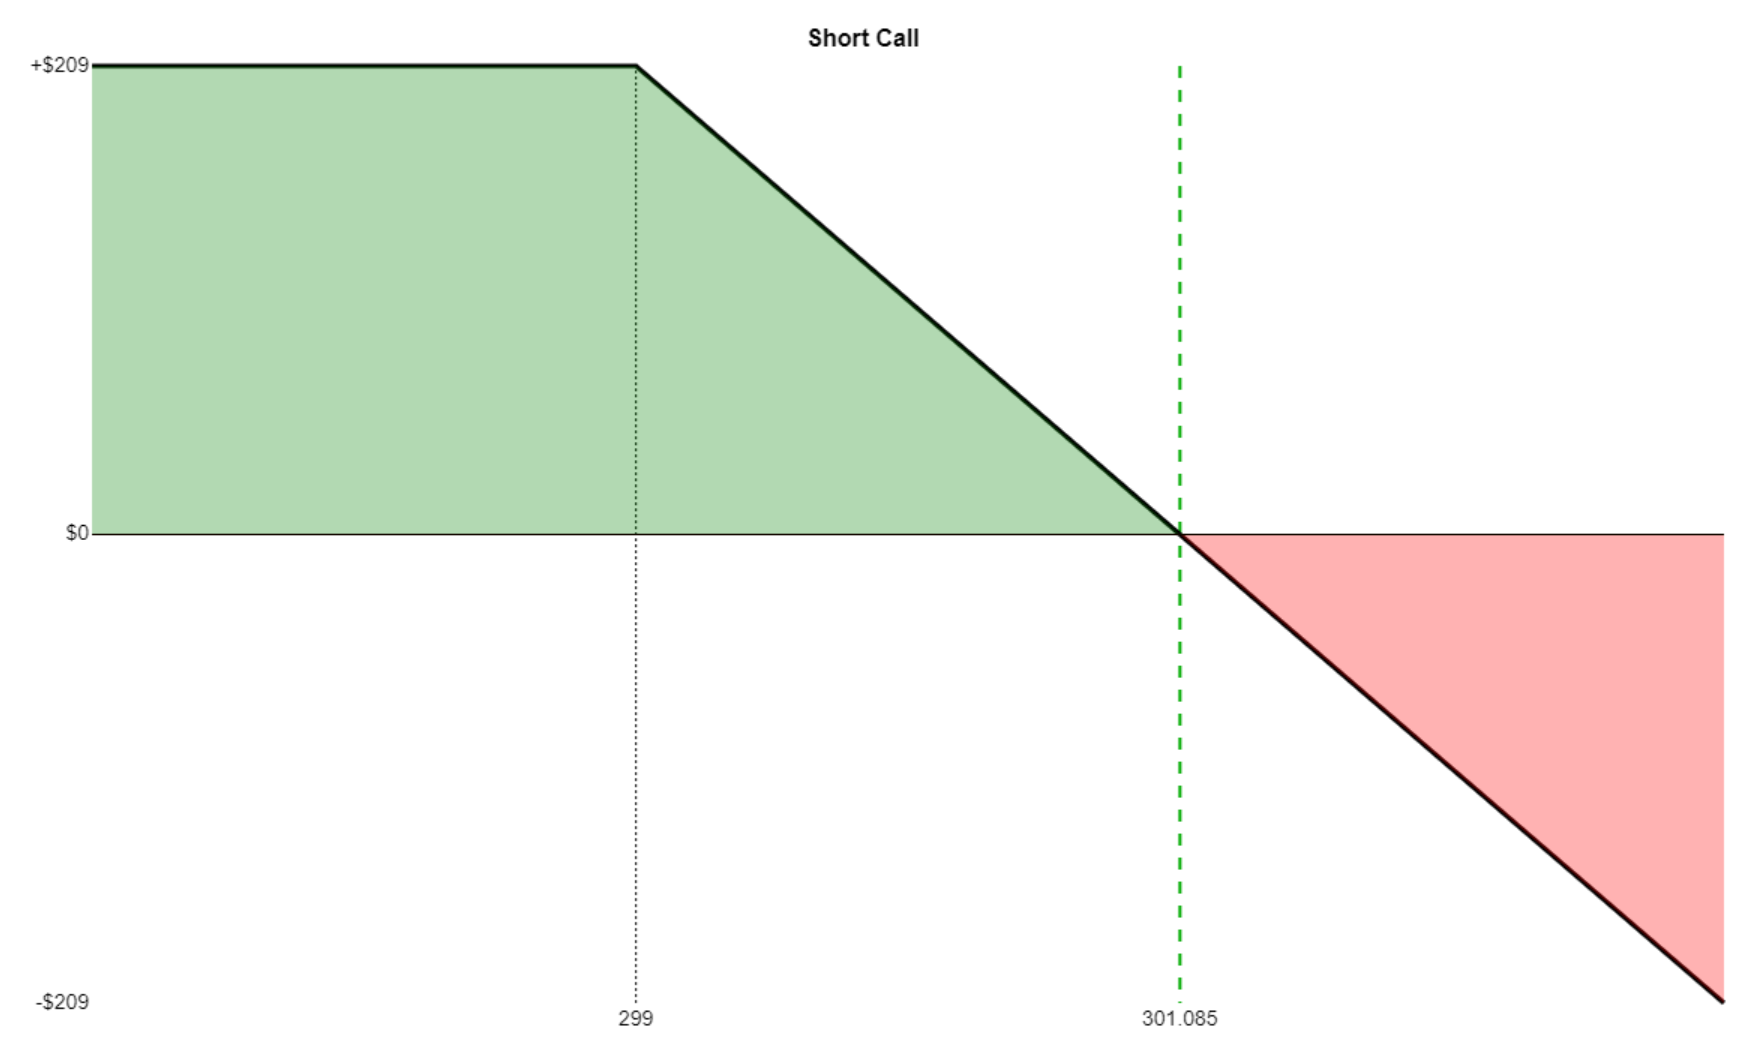
This is the simplest strategy possible, since it involves the buying (or selling) of a single option.
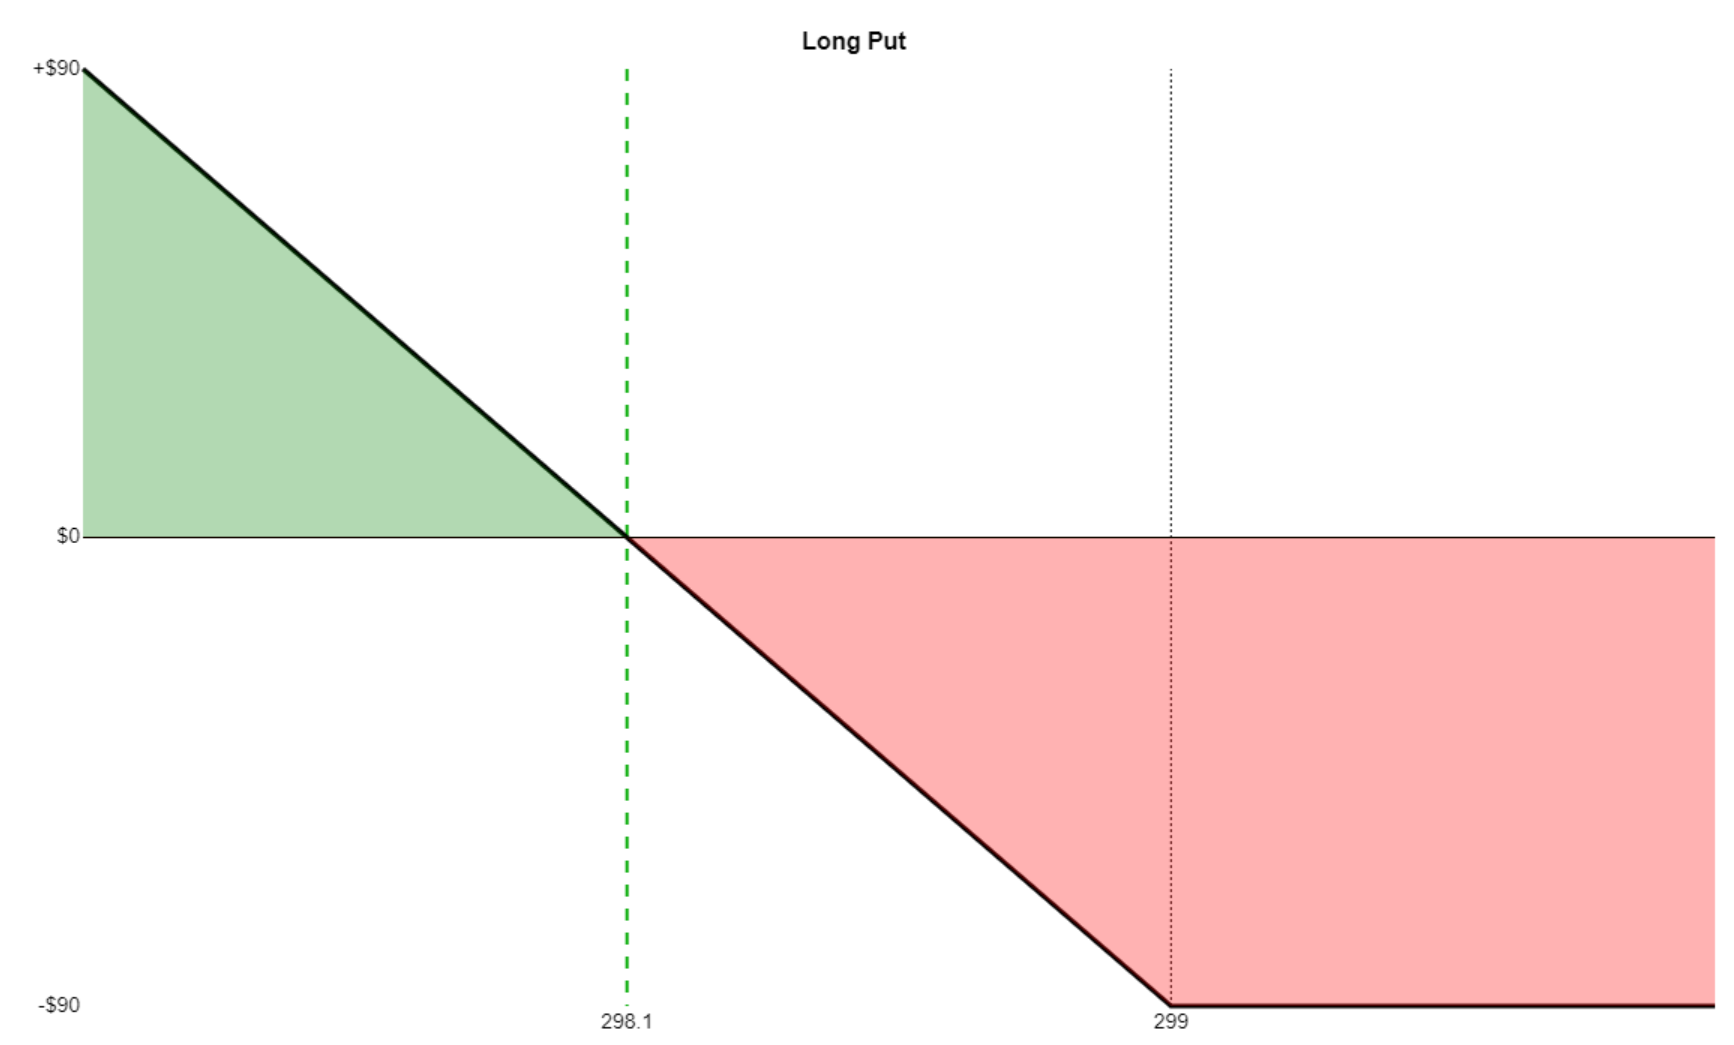
A long put position has these properties:
- Market View: Bearish;
- Opportunity: Substantial;
- Risk: Predefined and limited;
- Leg One: Purchase of put;
- Net Result: Debit to your account;
- Break-even Price: Strike value minus debit paid;
- Maximum Profit: (Strike price times 100) minus debit paid;
- Maximum Loss: Debit paid
Simplistic Example Trade:
- Buy a $70 put at $5
- Net debit is $5
- Break-even price is 70 minus 5, which is 65
- Maximum profit is $6,500
- Maximum loss is the net debit of 5 times 100, which is $500 per contract
Here is an example Payoff Analysis of this strategy, which uses different figures:
A short put position has these properties:
- Market View: Bullish;
- Opportunity: Predefined and limited;
- Risk: Substantial;
- Leg One: Sale of put;
- Net Result: Credit to your account;
- Break-even Price: Strike value minus premium received;
- Maximum Profit: Credit received;
- Maximum Loss: (Strike price times 100) minus the credit received
Simplistic Example Trade:
- Short a $70 put at $5
- Net credit is $5
- Break-even price is 70 minus 5, which is 65
- Maximum profit is the net credit of 5 times 100, which is $500 per contract
- Maximum loss is strike price of 70 minus 5, which is 65, times 100, which is $6500 per contract
Here is an example Payoff Analysis of this strategy, which uses different figures:

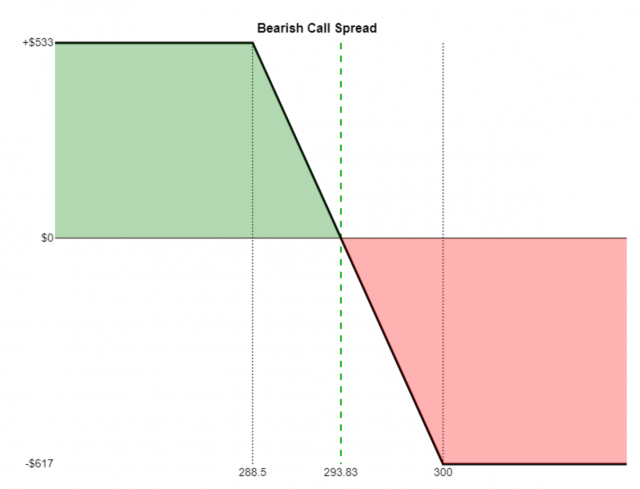
If the long call has a strike price higher than the short call, it is a bear call spread and has these properties:
- Market View: Bearish;
- Opportunity: Predefined and limited;
- Risk: Predefined and limited;
- Leg One: Sale of lower-strike call;
- Leg Two: Purchase of higher-strike call;
- Net Result: credit to your account;
- Break-even Price: Lower strike value plus credit received;
- Maximum Profit: Credit received;
- Maximum Loss: (Width of the spread times 100) minus the credit
Simplistic Example Trade:
- Sell a $70 call at $4
- Buy a $75 call at $1
- Net credit is $3
- Break-even price is 70 plus 3, which is 73
- Maximum profit is 3, times 100, which is $300
- Maximum loss is 5 (the spread width) minus 3, which is 2, times 100, equals $200
Here is an example Payoff Analysis of this strategy, which uses different figures.
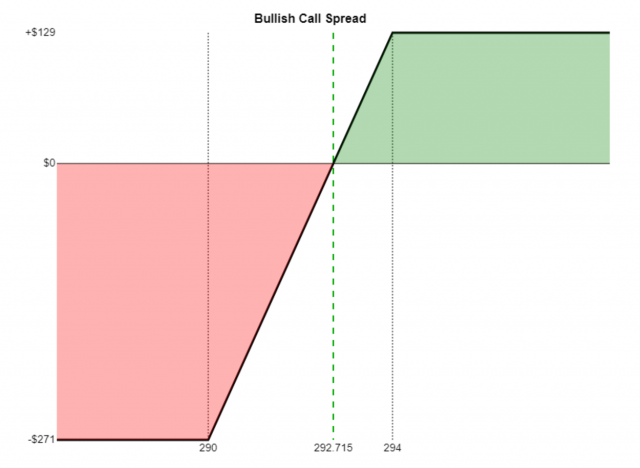
If the long call has a strike price lower than the short call, it is a bull call spread and has these properties:
- Market View: Bullish;
- Opportunity: Predefined and limited;
- Risk: Predefined and limited;
- Leg One: Purchase of lower-strike call;
- Leg Two: Sale of higher-strike call;
- Net Result: debit to your account;
- Break-even Price: Lower strike value plus debit paid;
- Maximum Profit: (Width of the spread times 100) minus the debit paid;
- Maximum Loss: Debit paid
Simplistic Example Trade:
- Buy a $70 call at $5
- Sell a $75 call at $3
- Net debit is $2
- Break-even price is 70 plus 2, which is 72
- Maximum profit is 5 (the spread width) minus 2, which is 3, times 100, equals $300
- Maximum loss is the net debit of 2 times 100, which is $200
Here is an example Payoff Analysis of this strategy, which uses different figures.
A put spread involves the simultaneous buying and sell of puts with the same expiration date and different strike prices. It is also known as a Vertical Spread.
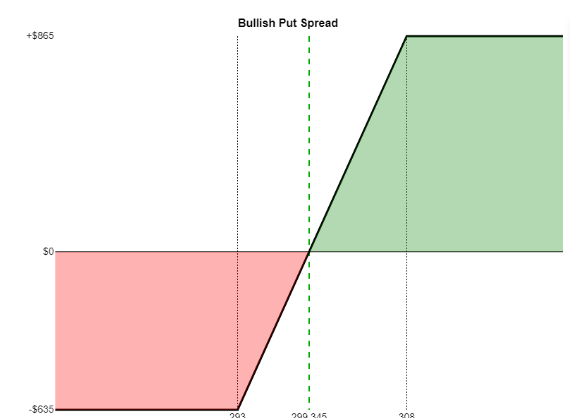
If the long put has a strike price lower than the short put , it is a bull put spread and has these properties:
- Market View: Bullish;
- Opportunity: Predefined and limited;
- Risk: Predefined and limited;
- Leg One: Purchase of lower-strike put ;
- Leg Two: Sale of higher-strike put ;
- Net Result: credit to your account;
- Break-even Price: Higher strike price minus the credit;
- Maximum Profit: Credit received;
- Maximum Loss: (Width of the spread times 100) minus the credit
Simplistic Example Trade:
- Buy a $70 put at $6
- Sell a $75 put at $9
- Net credit is $3
- Break-even price is 75 minus 3, which is 72
- Maximum profit is the net credit of 3 times 100, which is $300
- Maximum loss is the spread width of 5 minus the credit of 3, which is 2, times 100, equals $200.
Here is an example Payoff Analysis of this strategy, which uses different figures:
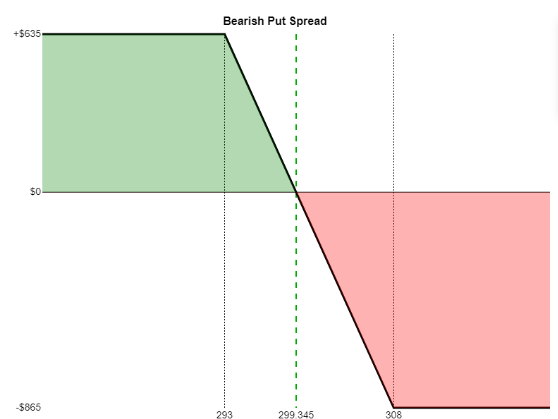
If the long put has a strike price higher than the short put , it is a bear put spread and has these properties:
- Leg One: Sale of lower-strike put;
- Leg Two: Purchase of higher-strike put;
- Net Result: debit to your account;
- Break-even Price: Higher strike value minus debit paid;
- Maximum Profit: (Width of the spread times 100) minus the debit;
- Maximum Loss: Debit paid
Simplistic Example Trade:
- Market View: Bearish;
- Opportunity: Predefined and limited;
- Risk: Predefined and limited;
- Sell a $70 put at $6
- Buy a $75 put at $9
- Net debit is $3
- Break-even price is 75 minus 3, which is 72
- Maximum profit is 5 (the spread width) minus 3, which is 2, times 100, equals $200
- Maximum loss is the net debit of 3 times 100, which is $300
Here is an example Payoff Analysis of this strategy, which uses different figures.
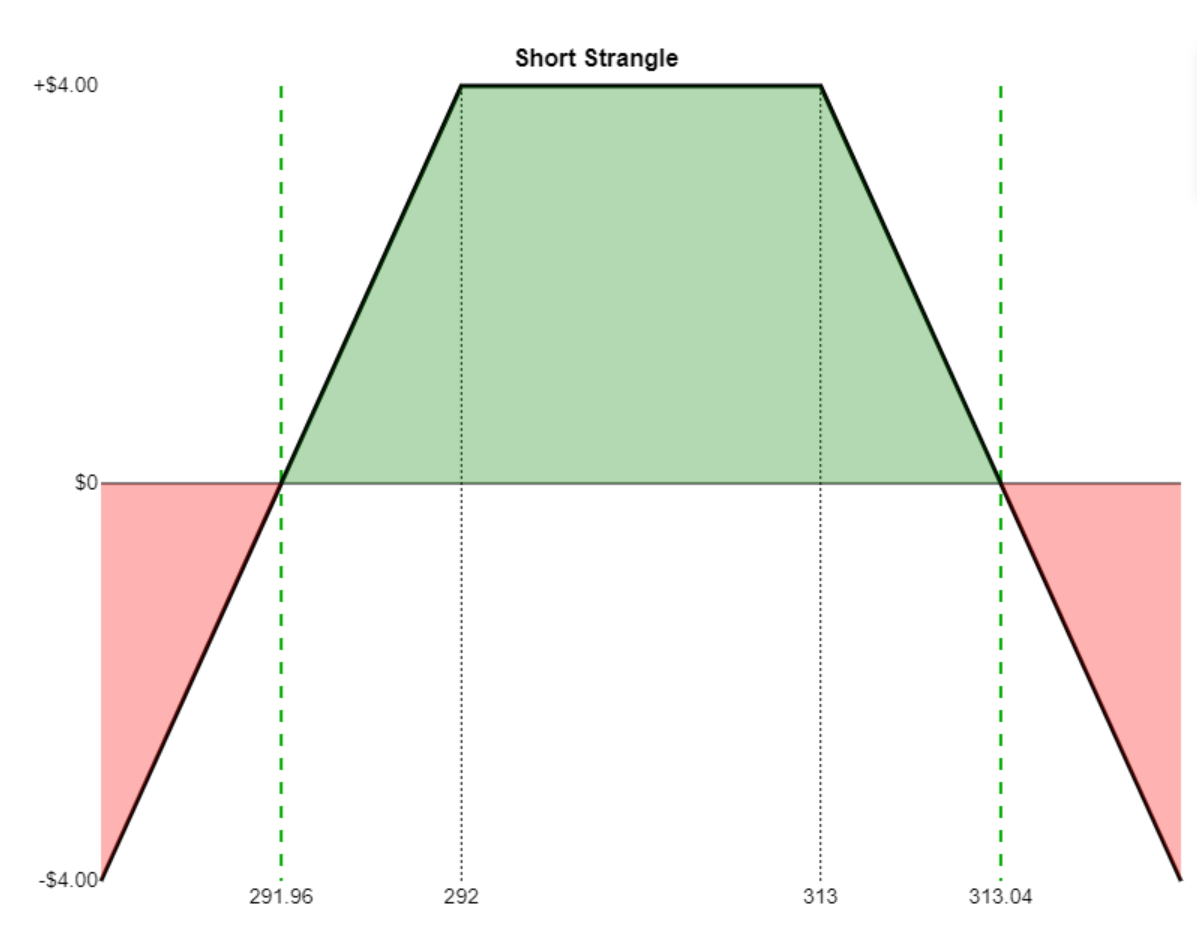
A strangle consists of two options, one of them a call, and one of them a put.
The short strangle has these properties:
- Market View: Neutral;
- Opportunity: Predefined and limited;
- Risk: Unlimited;
- Leg 1: The sale of an out-of-the-money put (lower strike price), also yielding a credit;
- Leg 2: The sale of an out-of-the-money call (higher strike), yielding a credit;
- Net result: a combined credit from the two option sales;
- Break-even Price One: strike price of the put minus the credit;
- Break-even Price Two: strike price of the call plus the credit
- Maximum Profit: Total credit received;
- Maximum Loss: Unlimited!
Simplistic Example Trade:
- Sell a $40 put for 3.25
- Sell a $50 call for 2.50
- Net credit is 2.50 plus 3.25, which is 5.75
- Break-even price number one is 40 minus 5.75 which is 34.25
- Break-even price number two is 50 plus 5.75 which is 55.75
- Maximum profit is the net credit of 5.75 times 100, which is $575
- Maximum loss is infinite!
Here is an example Payoff Analysis of this strategy, which uses different figures:
The long strangle has these properties:
- Market View: Bullish and Bearish (anticipate large move, not sure which way);
- Opportunity: Unlimited;
- Risk: Predefined and limited;
- Leg 1: The purchase of an out-of-the-money call (higher strike price), yielding a debit;
- Leg 2: The purchase of an out-of-the-money put (lower strike), also yielding a debit;
- Net Result: a combined debit from the two option purchases;
- Break-even Price One: strike price of the put minus the debit;
- Break-even Price Two: strike price of the call plus the debit
- Maximum Profit: Unlimited;
- Maximum Loss: Total debit paid
Simplistic Example Trade:
- Buy a $50 call for 2.50
- Buy a $40 put for 3.25
- Net debit is 2.50 plus 3.25, which is 5.75
- Break-even price number one is 40 minus 5.75 which is 34.25
- Break-even price number two is 50 plus 5.75 which is 55.75
- Maximum profit is infinite!
- Maximum loss is the net debit of 5.75 times 100, which is $575
Here is an example Payoff Analysis of this strategy, which uses different figures:

This involves either selling both a call and a put or buying a call and a put. In either circumstance, the strike price and the expiration are identical.
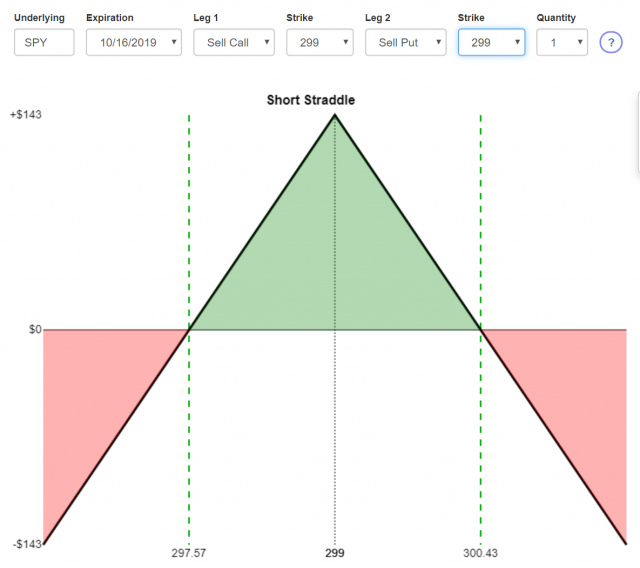
If you are selling a call and a put, this is a short straddle. It has the following properties:
- Market View: Neutral;
- Opportunity: Predefined and limited;
- Risk: Unlimited;
- Leg 1: a short call;
- Leg 2: a short put with the same strike price and expiration of leg 1;
- Net Result: credits from both legs, resulting in a net credit;
- Break-even price one: strike price plus the credit;
- Break-even price two: strike price minus the credit;
- Maximum Profit: credit received;
- Maximum Loss: unlimited!
Simplistic Example Trade:
- Sell a $50 call for 2.50
- Sell a $50 put for 3.25
- Net credit is 2.50 plus 3.25, which is 5.75
- Break-even price number one is 50 minus 5.75 which is 44.25
- Break-even price number two is 50 plus 5.75 which is 55.75
- Maximum profit is the net credit of 5.75 times 100, which is $575
- Maximum loss is infinite!
Here is an example Payoff Analysis of this strategy, which uses different figures:
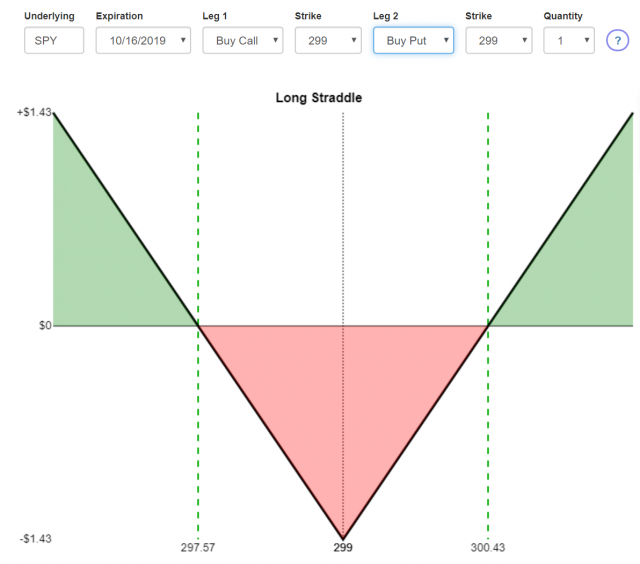
If you are buying a call and a put, this is a long straddle. It has the following properties:
- Market View: Bearish and Bullish (anticipate big move, not sure which way);
- Opportunity: Unlimited;
- Risk: Predefined and limited;
- Leg 1: a long call;
- Leg 2: a long put with the same strike price and expiration of leg 1;
- Net Result: debits from both legs, resulting in a net debit;
- Break-even Price One: strike price plus the debit;
- Break-even Price Two: strike price minus the debit;
- Maximum Profit: unlimited;
- Maximum Loss: debit paid
Simplistic Example Trade:
- Buy a $50 call for 2.50
- Buy a $50 put for 3.25
- Net debit is 2.50 plus 3.25, which is 5.75
- Break-even price number one is 50 minus 5.75 which is 44.25
- Break-even price number two is 50 plus 5.75 which is 55.75
- Maximum profit is infinite!
- Maximum loss is the net debit of 5.75 times 100, which is $575
Here is an example Payoff Analysis of this strategy, which uses different figures:
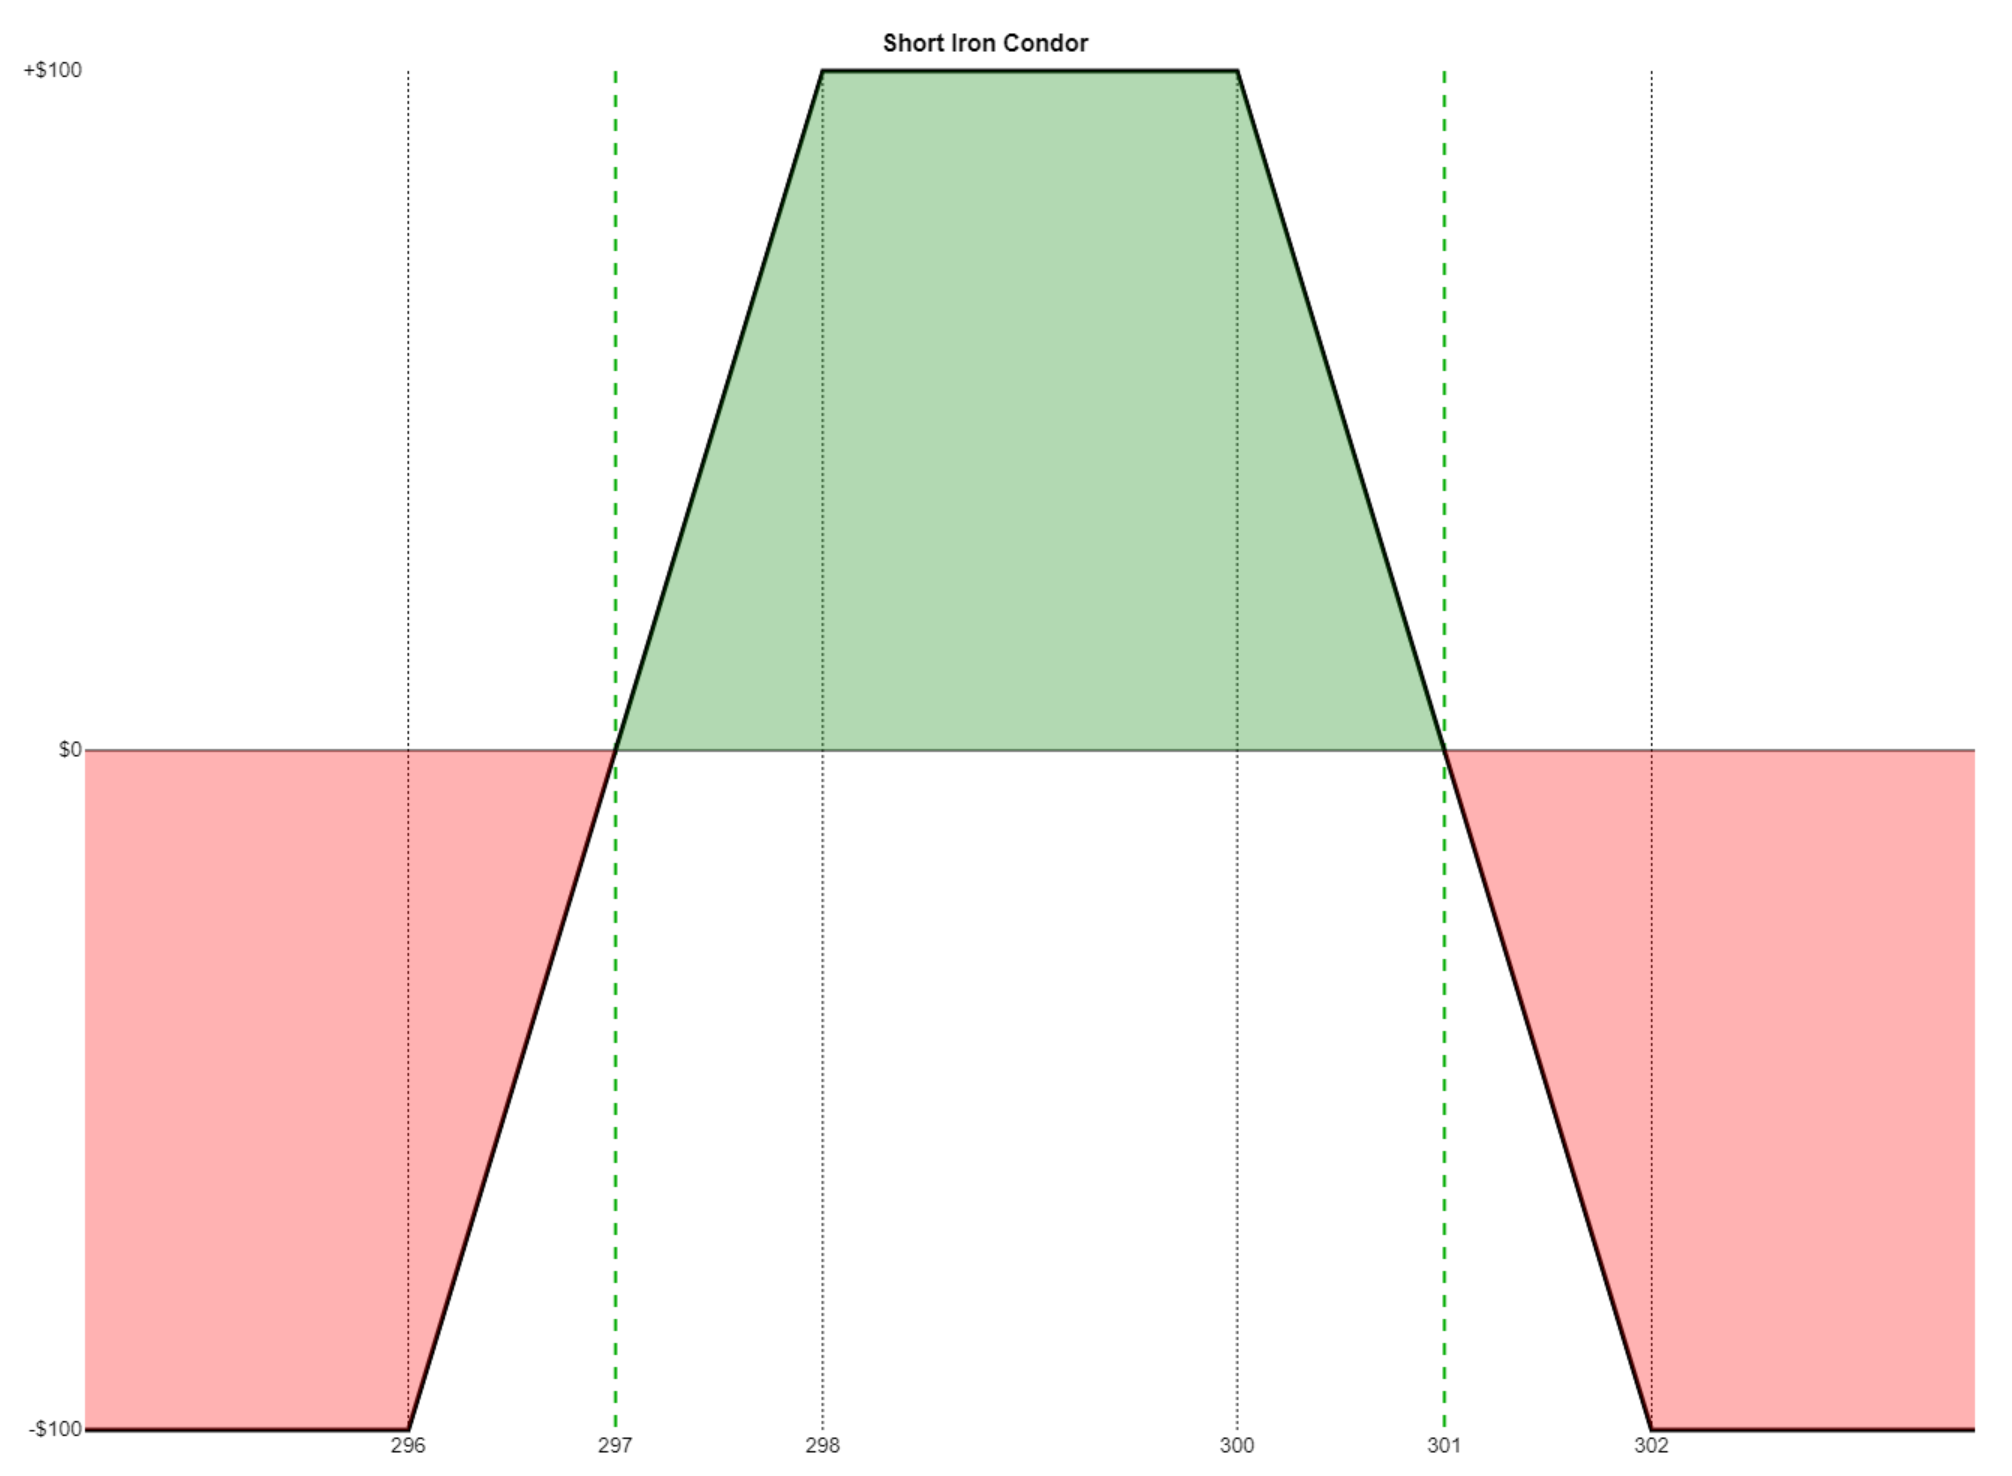
The short iron condor has the following properties:
- Market View: Neutral;
- Opportunity: Predefined and limited;
- Risk: Predefined and limited;
- Leg 1: the lowest strike price, a long put position, creating a debit;
- Leg 2: the second-lowest strike price, a short put position, yielding a credit;
- Leg 3: the second-highest strike price, a short call position, yielding a credit;
- Leg 4: the highest strike price, a long call position, yielding a debit;
- Net Result: combined credits of legs 2 and 3, minus the combined debits of legs 1 and 4, yields a net credit;
- Break-even One: strike price of leg 3 plus the credit;
- Break-even Two: strike price of leg 2 minus the credit
- Maximum Profit: net credit received;
- Maximum Loss: there are two spread widths to consider: the distance between the puts (legs 1 and 2) and the distance between the calls (legs 3 and 4). Whichever is the greater of these, minus the credit received, equals the maximum loss.
Simplistic Example Trade:
- Buy a $40 put for $1
- Sell a $50 put for $2
- Sell a $60 call for $4
- Buy a $70 call for $3
- So there are two “credits received”. Subtract the two “debits paid” and that is net credit. So that would be (2+4) – (1+3), a net credit of 2.
- Break-even price number one is 60 plus 2, which is 62
- Break-even price number two is 50 minus 2, which is 48
- Maximum profit is the credit received, 2, times 100, which is $200
- Maximum loss is the greater of the widths between the put strikes or the call strikes, minus the total credit received. In this example, the maximum loss would be (70-60)-2=8 on the call side and (50-40)-2=8 on the put side. So the maximum loss is 8, times 100, which is $800.
Here is an example Payoff Analysis of this strategy, which uses different figures:
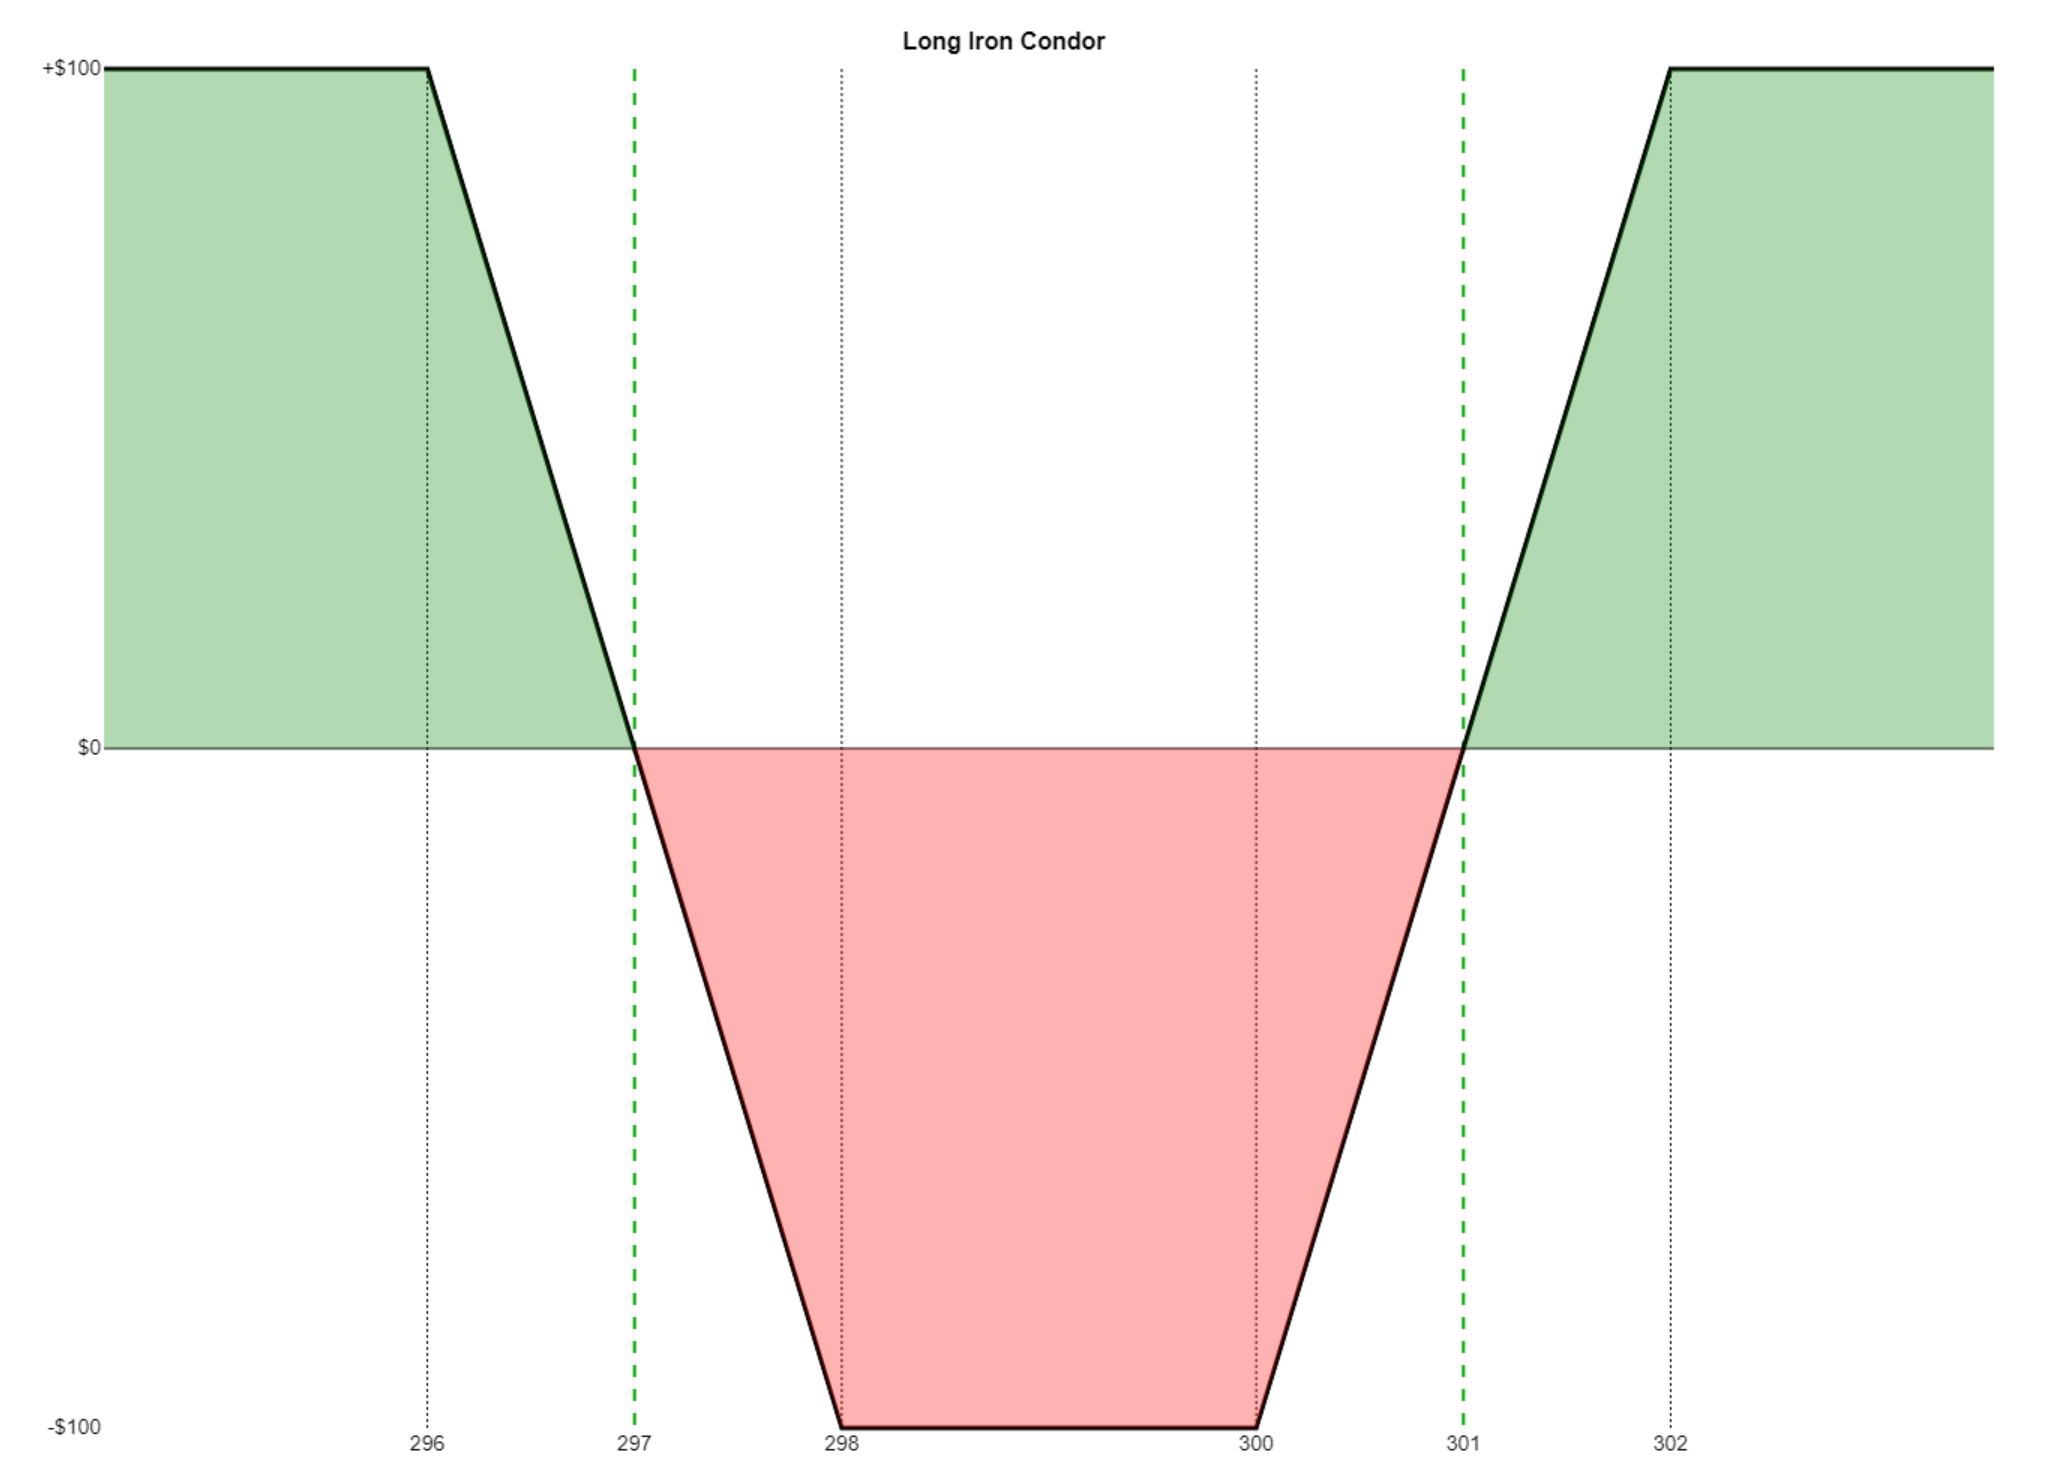
The long iron condor has the following properties:
- Market View: Bearish and Bullish (anticipate big move, not sure which way);
- Opportunity: Predefined and limited;
- Risk: Predefined and limited;
- Leg 1: the lowest strike price, a short put position, yielding a credit;
- Leg 2: the second-lowest strike price, a long put position, yielding a debit;
- Leg 3: the second-highest strike price, a long call position, yielding a debit;
- Leg 4: the highest strike price, a short call position, yielding a credit;
- Net Result: combined credits of legs 1 and 4, minus the combined debits of legs 2 and 3, yields a net debit;
- Break-even One: strike price of leg 3 plus the debit;
- Break-even Two: strike price of leg 2 minus the debit
- Maximum Profit: there are two spread widths to consider: the distance between the calls (legs 1 and 2) and the distance between the puts (legs 3 and 4). Whichever is the greater of these, minus the debit paid, equals the maximum profit;
- Maximum Loss: debit paid.
Simplistic Example Trade:
- Sell a $40 put for $1
- Buy a $50 put for $2
- Buy a $60 call for $4
- Sell a $70 call for $3
- So there are two “credits received”. Subtract the two “debits paid” and that is net debit. So that would be (3+1) – (2+4), a net debit of 2.
- Break-even price number one is 60 plus 2, which is 62
- Break-even price number two is 50 minus 2, which is 48
- Maximum profit is the greater of the widths between the put strikes or the call strikes, minus the total debit. In this example, the maximum loss would be 70-60-2=8 on the call side and 50-40-2=8 on the put side. So the maximum profit is 8, times 100, which is $800.
- Maximum loss the debit paid, 2, times 100, which is $200
Here is an example Payoff Analysis of this strategy, which uses different figures:
The Short Iron Butterfly consists of a long put (at the lowest strike price), a short put and a short call (both at the same strike price, higher than the first leg), and a long call position (at the highest of the three strike prices). It has these properties:
- Market View: Neutral;
- Opportunity: Predefined and limited;
- Risk: Predefined and limited;
- Leg One: Purchase of put at the lowest strike price (debit paid);
- Leg Two: Sale of put at the medium strike price (credit received);
- Leg Three: Sale of a call at the same medium strike price (credit received);
- Leg Four: Purchase of call at the highest strike price (debit paid);
- Net Result: The two credits received minus the two debits paid yield a net credit to your account
- Break-even Price One: The strike price in the middle minus the net credit received;
- Break-even Price Two: The strike price in the middle plus the net credit received;
- Maximum Profit: Net credit;
- Maximum Loss: There are two spread widths to consider: the distance between the puts (legs 1 and 2) and the distance between the calls (legs 3 and 4). Whichever is the greater of these, minus the credit received, equals the maximum loss.
Simplistic Example Trade:
- Buy a $40 put for $7
- Sell a $50 put for $10
- Sell a $50 call for $5
- Buy a $60 call for $2
- So there are two “credits received”. Subtract the two “debits paid” and that is net credit. So that would be (10+5) – (7+2), a net credit of 6.
- Break-even price number one is 50 minus 6, which is 44
- Break-even price number two is 50 plus 6, which is 56
- Maximum profit is the credit received, 6, times 100, which is $600
- Maximum loss is the maximum width between the either the put strikes or the call strikes, minus the total credit received. In this example, the maximum loss would be 60-50-6=4 on the CALL side and 50-40-6=4 on the PUT side, so the max loss is 4 times 100, or $400
Here is an example Payoff Analysis of this strategy, which uses different figures:
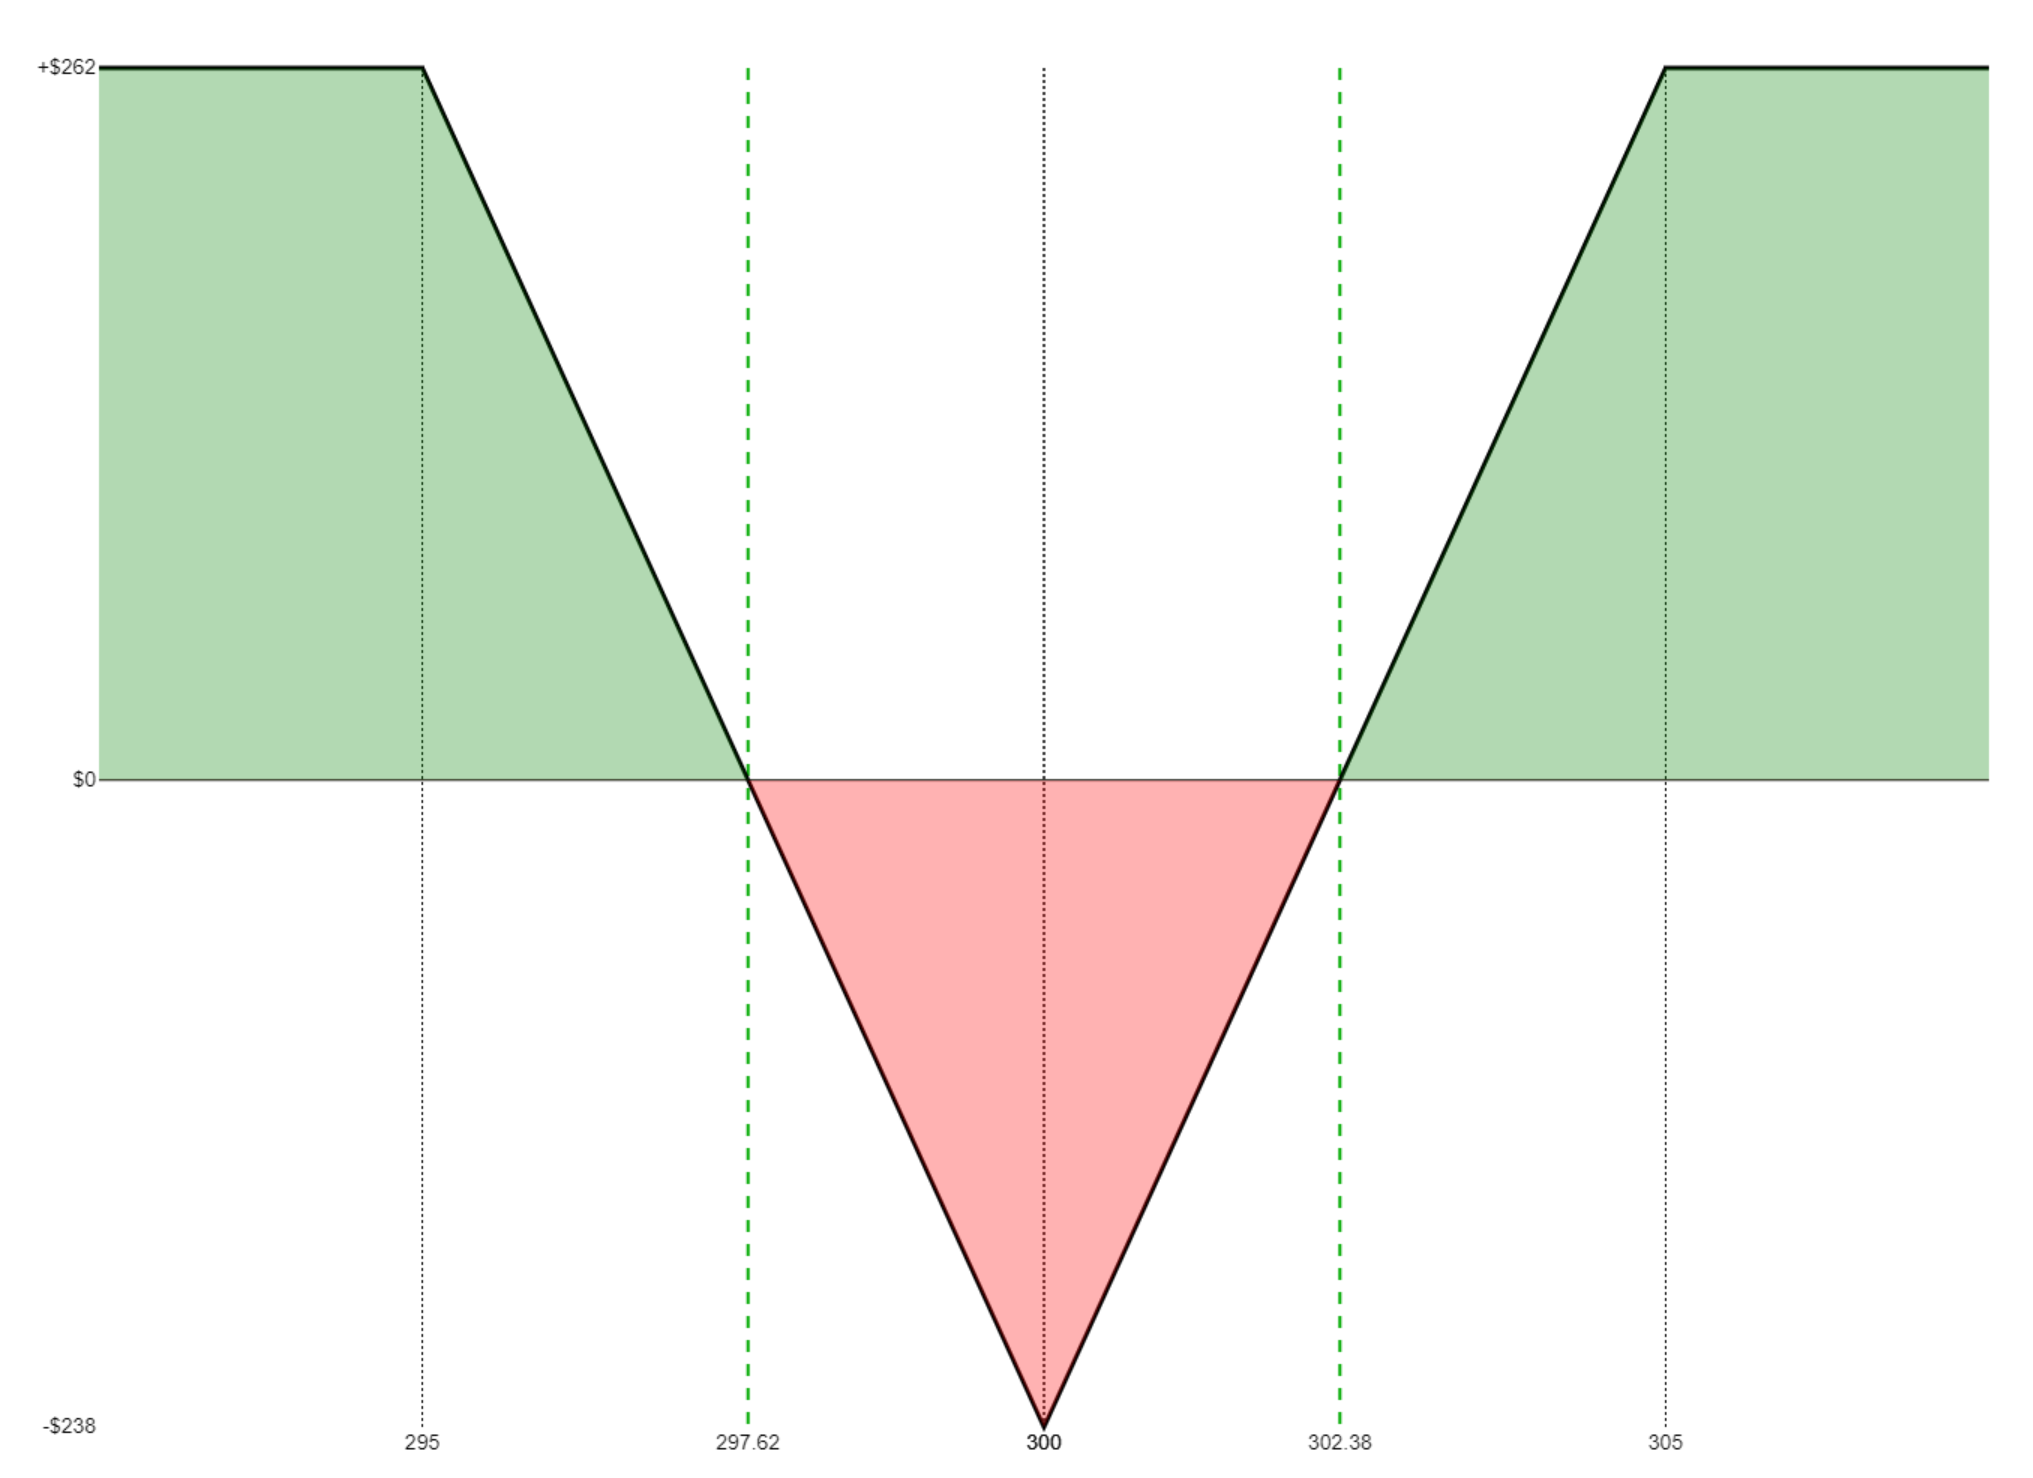
The Long Iron Butterfly consists of a short put (at the lowest strike price), a long put and a long call (both at the same strike price, higher than the first leg), and a short call position (at the highest of the three strike prices). It has these properties:
- Market View: Neutral (anticipate large move, not sure which direction);
- Opportunity: Predefined and limited;
- Risk: Predefined and limited;
- Leg One: Short put at the lowest strike price (credit received);
- Leg Two: Long put at the medium strike price (debit paid);
- Leg Three: Long call at the same medium strike price (debit paid);
- Leg Four: Short call at the highest strike price (credit received);
- Trade Price: The two credits received minus the two debits paid yield a net debit to your account;
- Break-even Put Side: The strike price in the middle minus the trade price;
- Break-even Call Side: The strike price in the middle plus the trade price;
- Maximum Profit: There are two spread widths to consider: the distance between the puts (legs 1 and 2) and the distance between the calls (legs 3 and 4). Whichever is the greater of these, minus the debit paid, equals the maximum profit;
- Maximum Loss: Debit paid.
Simplistic Example Trade:
- Sell a $40 put for $3
- Buy a $50 put for $5
- Buy a $50 call for $2
- Sell a $60 call for $1
- So there are two “credits received”. Subtract the two “debits paid” and that is net debit. So that would be (3+1) – (5+2), a net debit of 3.
- Break-even put side is 50 minus 3, which is 47
- Break-even call side is 50 plus 3, which is 53
- Maximum profit is the maximum width between the either the put strikes or the put strikes, minus the total debit paid. In this example, the maximum profit would be (60-50)-3=7 on the CALL side and (50-40)-3=7 on the PUT side, so the maximum profit is 7, times 100, or $700
- Maximum loss the debit paid, 3, times 100, which is $300
Here is an example Payoff Analysis of this strategy, which uses different figures:
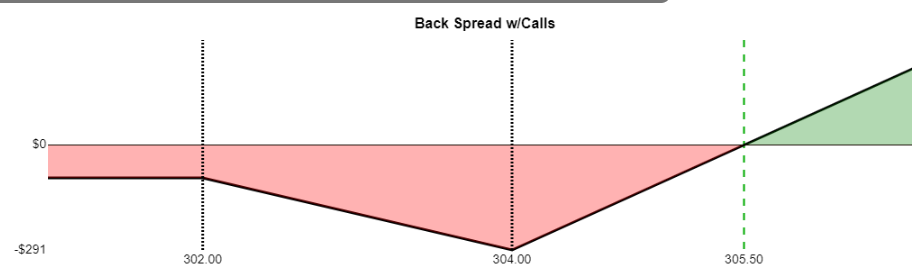
The Back Spread with Calls has the following properties:
- Market View: Bullish;
- Opportunity: Unlimited;
- Risk: Predefined and limited;
- Leg 1: a short call;
- Leg 2: two long calls at a higher strike price with the same expiration as leg 1;
- Net Result: it depends on the options prices: it could be a net credit or a net debit;
- Break-even price if debit paid: strike of leg 2 plus the spread between leg 1 and leg 2 plus the debit paid;
- Break-even price one if credit received: strike of leg 1 plus the credit received;
- Break-even price two if credit received: strike of leg 2 plus the spread between leg 1 and leg 2 minus the credit received;
- Maximum Profit: unlimited;
- Maximum Loss: spread between leg 1 and leg 2 minus the credit received (or plus the debit paid)
Simplistic Example Trade:
- Sell a $50 call for 2.50
- Buy two $60 calls for 7.50
- Net debit is (7.50 times 2) minus 2.50 which is 12.50
- Break-even price is 60 plus 10 plus 12.50, which is 82.50
- Maximum profit is unlimited
- Maximum loss is 10 plus 12.50, which is 22.50, times 100, or $2,250 per contract
Here is an example Payoff Analysis of this strategy, which uses different figures:
The Back Spread with Puts has the following properties:
- Market View: Bearish;
- Opportunity: Substantial;
- Risk: Predefined and limited;
- Leg 1: two long puts;
- Leg 2: one short put at a higher strike price with the same expiration as leg 1;
- Net Result: it depends on the options prices: it could be a net credit or a net debit;
- Break-even price if debit paid: strike of leg 1 minus the spread between leg 1 and leg 2 minus the debit paid;
- Break-even price one if credit received: strike of leg 1 minus the spread between legs 1 and 2 plus the credit received;
- Break-even price two if credit received: strike of leg 2 minus the net credit received;
- Maximum Profit: twice the value of the strike at leg 1 minus the debit paid, if any, minus the value of the strike at leg 2;
- Maximum Loss: spread between leg 1 and leg 2 minus the credit received (or plus the debit paid)
Simplistic Example Trade:
- Buy two $50 puts for 7
- Sell one $55 put for 10
- Net debit is (7 times 2) minus 10.00 which is 4.00
- Break-even price is 50 minus 5 minus 4 which is 41.00
- Maximum profit is 50 doubled, which is 100, minus 4, minus 55, which is 41, times 100, or $4,100 per contract
- Maximum loss is 5 plus 4, which is 9, times 100, or $900 per contract
Here is an example Payoff Analysis of this strategy, which uses different figures:

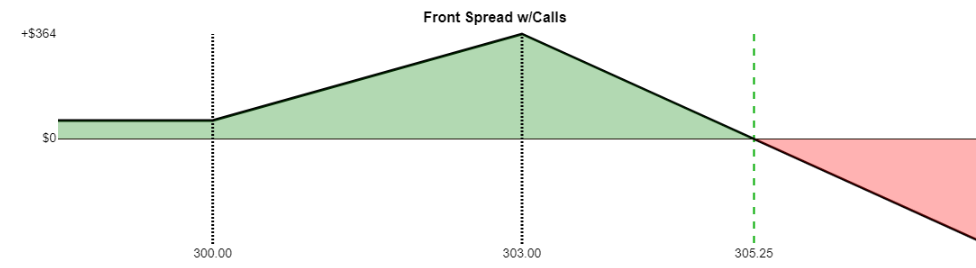
The Front Spread with Calls consists of one long call and the sale of two calls at a higher strike price. It has these properties:
- Market View: Neutral;
- Opportunity: Predefined and limited;
- Risk: Unlimited;
- Leg One: Purchase of a call at the lower strike price (debit paid);
- Leg Two: Sale of two calls at a higher strike price (credit received);
- Net Result: Depending on option prices, could be net debit or net credit;
- Break-even price one if debit paid: Lower strike price plus net debit;
- Break-even price two if debit paid: Higher strike price plus the spread between the strikes minus the debit;
- Break-even if credit received: Higher strike price plus the spread between the strikes plus the credit received;
- Maximum Profit: The difference between the strike prices minus the debit (or plus the credit, as the case may be);
- Maximum Loss: Unlimited!
Simplistic Example Trade:
- Buy a $40 call for $10 ($10 debit)
- Sell two $45 calls at $6 each ($12 credit)
- $12 credit less $10 debit results in $2 credit
- Break-even price is 45 plus 5 plus the credit of 2, which totals 52
- Maximum profit is the spread of 5 plus 2, which is 7, times 100, which is $700 per contract
- Maximum loss is theoretically unlimited
Here is an example Payoff Analysis of this strategy, which uses different figures:
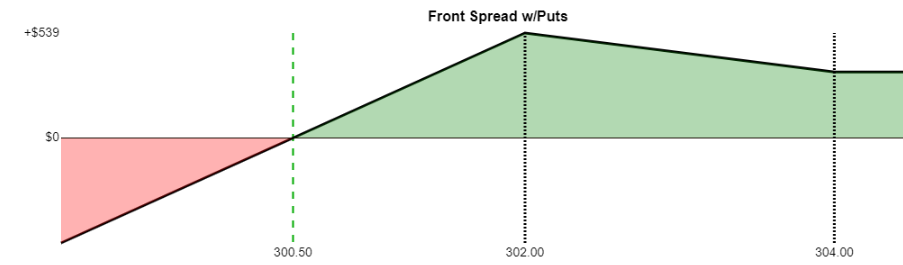
The Front Spread with Puts consists of two short puts and the purchase of one put at a higher strike price. It has these properties:
- Market View: Neutral;
- Opportunity: Predefined and limited;
- Risk: Substantial;
- Leg One: Sale of a two puts at the lower strike price (credit received);
- Leg Two: Purchase of one puts at a higher strike price (debit paid);
- Net Result: Depending on option prices, could be net debit or net credit;
- Break-even price one if debit paid: Higher strike price minus net debit;
- Break-even price two if debit paid: Lower strike price minus the spread between the strikes plus the debit paid;
- Break-even if credit received: Lower strike price minus the spread between the strikes minus the credit received;
- Maximum Profit: The difference between the strike prices minus the debit (or plus the credit, as the case may be);
- Maximum Loss: The spread between $0 and the lower strike price plus the debit (or minus the credit)
Simplistic Example Trade:
- Sell two $40 puts for $9 ($18 credit)
- Buy one $45 puts at $13 ($13 debit)
- $18 credit less $13 debit results in $5 credit
- Break-even price is 40 minus 5 minus the credit of 5, which is $30
- Maximum profit is the spread of 5 plus the credit of 5, which is 10, times 100, which is $1,000 per contract
- Maximum loss is the lower strike of 40, minus the credit of 5, which is 35, times 100, yielding a risk of $3,500 per contract
Here is an example Payoff Analysis of this strategy, which uses different figures:
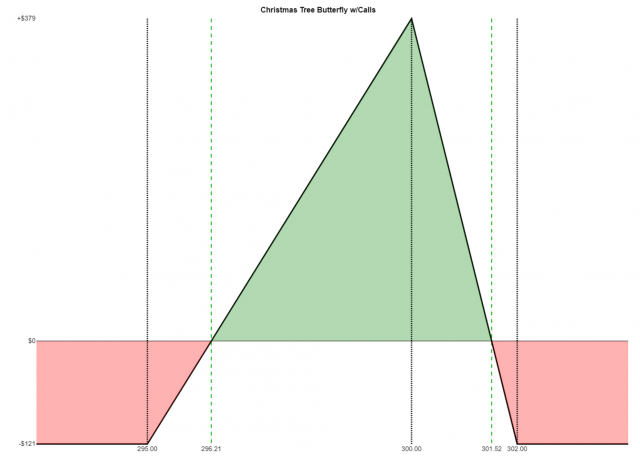
The Christmas Tree Butterfly with Calls consists of a long call, three short calls at a higher strike price, and two long calls at an even higher strike. It has these properties:
- Market View: Neutral;
- Opportunity: Predefined and limited;
- Risk: Predefined and limited;
- Leg One: Purchase of a call at the lowest strike price (debit paid);
- Leg Two: Sale of three calls at a higher strike price (credit received);
- Leg Three: Purchase of two calls at the highest strike price (debit paid);
- Net Result: Proceeds of leg two minus price paid for legs one and three, resulting in a net debit;
- Break-even Price One: The strike price of leg 1 plus the debit paid;
- Break-even Price Two: The strike price of leg 3 minus one-half the debit paid;
- Maximum Profit: The difference between the strike prices of legs 2 and 1 minus the debit paid;
- Maximum Loss: the debit paid
Simplistic Example Trade:
- Buy a $40 call for $10 ($10 debit)
- Sell three $50 calls at $2 each ($6 credit)
- Buy two $55 calls at $1 each ($2 debit)
- Therefore, a total of $12 paid out minus $6 received yields a net debit of $6
- Break-even price number one is 40 plus 6, which is 46
- Break-even price number two is 55 minus half of 6, which is 52
- Maximum profit is 10 minus 6, which is 4, times 100, resulting in $400 per contract
- Maximum loss is the net debit of 6 times 100, resulting in $600 per contract
Here is an example Payoff Analysis of this strategy, which uses different figures:
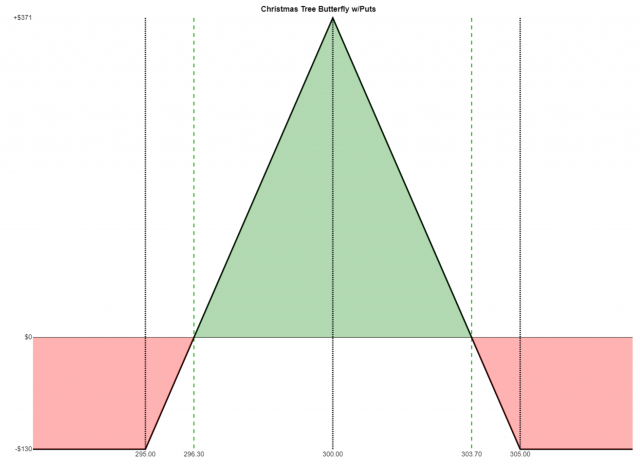
The Christmas Tree Butterfly with Puts consists of the purchase of two puts, the sale of three puts at a higher strike price, and the purchase of a put at an even higher strike. It has these properties:
- Market View: Neutral;
- Opportunity: Predefined and limited;
- Risk: Predefined and limited;
- Leg One: Purchase of two puts at the lowest strike price (debit paid);
- Leg Two: Sale of three puts at a higher strike price (credit received);
- Leg Three: Purchase of a put at the highest strike price (debit paid);
- Net Result: Proceeds of leg two minus cost of legs one and three, resulting in a net debit
- Break-even Price One: The strike price of leg 1 plus one half the debit paid;
- Break-even Price Two: The strike price of leg 3 minus the debit paid;
- Maximum Profit: The difference between the strike prices of legs 2 and 3 minus the debit paid;
- Maximum Loss: the debit paid
Simplistic Example Trade
- Buy two $40 puts for $0.70($1.40 debit)
- Sell three $45 puts at $2.10 each ($6.30 credit)
- Buy a $55 put at $8.25 each ($8.25 debit)
- Therefore, a total of $6.30 received minus 8.25 and 1.40 yields a net debit of $3.35
- Break-even price number one is 40 plus 1.675, which is 41.675
- Break-even price number two is 55 minus 3.35, which is 51.65
- Maximum profit is 10 minus 3.35, which is 6.65, times 100, resulting in $665 per contract
- Maximum loss is the net debit of 3.35 times 100, resulting in $335 per contract
Here is an example Payoff Analysis of this strategy, which uses different figures:
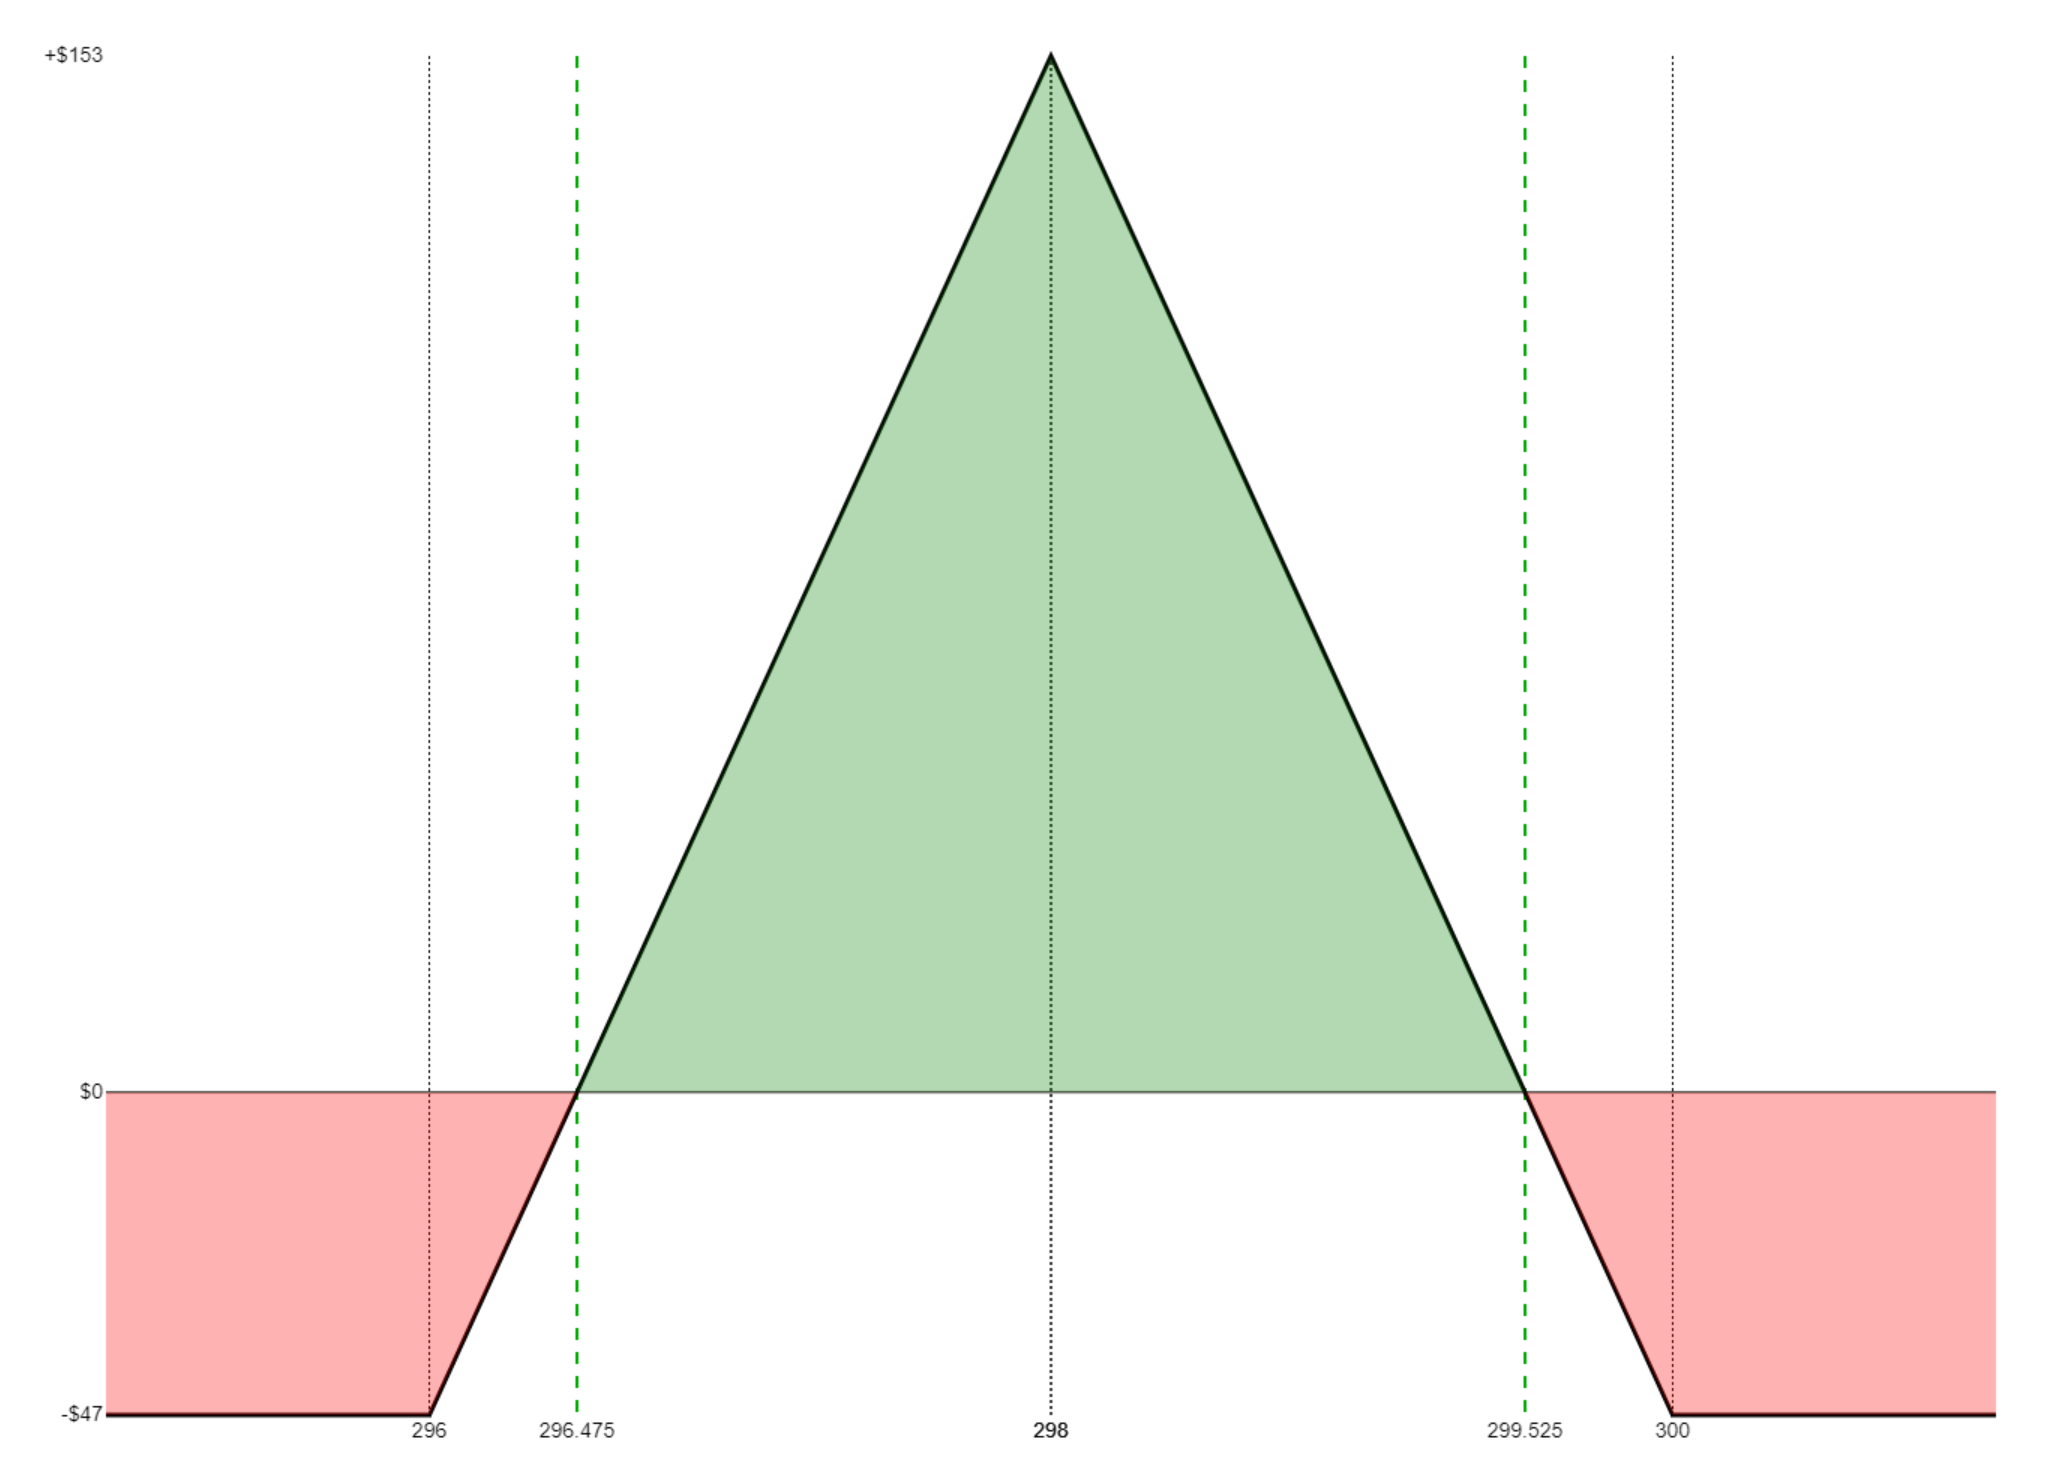
The Long Butterfly Spread with Calls consists of a long call (at the lowest strike price), the sale of two calls (both at the same strike price, higher than the first leg), and a long call position (at the highest of the three strike prices) forming equal width wings. It has these properties:
- Market View: Neutral;
- Opportunity: Predefined and limited;
- Risk: Predefined and limited;
- Leg One: Purchase of call at the lowest strike price (debit paid);
- Leg Two: Sale of two calls at the medium strike price (credit received);
- Leg Three: Purchase of call at the highest strike price (debit paid);
- Net Result: The credit received minus the two debits paid yield a net debit to your account
- Break-even Price One: The strike price of leg 1 plus the debit paid;
- Break-even Price Two: The strike price of leg 3 minus the debit paid;
- Maximum Profit: The spread between the leg 1 and leg 2 strikes minus the debit paid;
- Maximum Loss: Debit paid.
Simplistic Example Trade:
- Buy $95 call at 6.40 (debit of 6.40)
- Sell two $100 calls at $3.30 (credit of 6.60)
- Buy $105 call at $1.45 (debit of 1.45)
- The credit of 6.60 minus the debits of 6.40 and 1.45 yield a debit of 1.25
- Break-even price number one is 95 plus 1.25, which is 96.25
- Break-even price number two is 105 minus 1.25, which is 103.75
- Maximum profit is the spread of 5 minus the 1.25 debit, which is 3.75, times 100, or $375 per contract
- Maximum loss is the debit of 1.25, times 100, or $125 per contract
Here is an example Payoff Analysis of this strategy, which uses different figures:

The Long Butterfly Spread with Puts consists of a long put (at the lowest strike price), the sale of two puts (both at the same strike price, higher than the first leg), and a long put position (at the highest of the three strike prices). It has these properties:
- Market View: Neutral;
- Opportunity: Predefined and limited;
- Risk: Predefined and limited;
- Leg One: Purchase of put at the lowest strike price (debit paid);
- Leg Two: Sale of two puts at the medium strike price (credit received);
- Leg Three: Purchase of put at the highest strike price (debit paid);
- Net Result: The credit received minus the two debits paid yield a net debit to your account
- Break-even Price One: The strike price of leg 1 plus the debit paid;
- Break-even Price Two: The strike price of leg 3 minus the debit paid;
- Maximum Profit: The spread between the leg 1 and leg 2 strikes minus the debit paid;
- Maximum Loss: Debit paid.
Simplistic Example Trade:
- Buy $95 put at 1.25 (debit of 1.25)
- Sell two $100 puts at 3.15 (credit of 6.30)
- Buy $105 put at 6.25 (debit of 6.25)
- The credit of 6.30 minus the 1.25 and 6.25 debits results in a net debit of 1.20
- Break-even price number one is 95 plus 1.20, which is 96.20
- Break-even price number two is 105 minus 1.20, which is 103.80
- Maximum profit is the spread of 5 minus the 1.20 debit, which is 3.80, times 100, or $380 per contract
- Maximum loss is the debit of 1.20, times 100, or $120 per contract
Here is an example Payoff Analysis of this strategy, which uses different figures:

This strategy involves two options at different strike prices plus two other options at the identical strike price (between the other two).
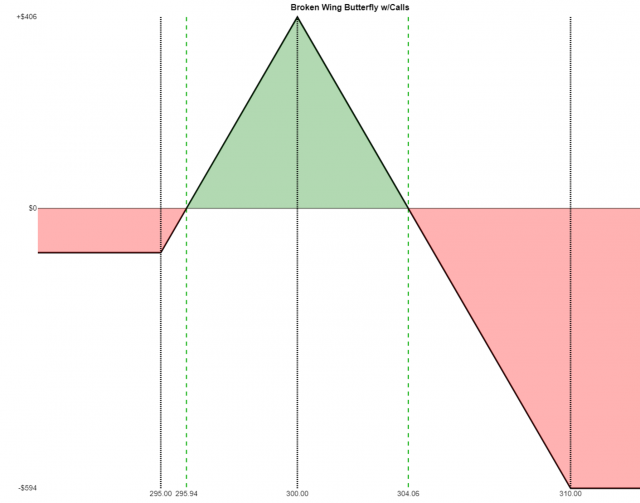
The Broken Wing Butterfly with Calls consists of a long call (at the lowest strike price), two short calls (middle strike), and a long call (at the highest of the three strike prices). It has these properties:
- Market View: Neutral;
- Opportunity: Predefined and limited;
- Risk: Predefined and limited;
- Leg One: Purchase of call at the lowest strike price (debit paid);
- Leg Two: Sale of two calls at the medium strike price (credit received);
- Leg Three: Purchase of call at the highest strike price (debit paid);
- Net Result: The credit received minus the two debits paid yield a credit or debit, depending on the option prices;
- Break-even Price if credit received: The strike price of leg two plus the maximum profit (defined below);
- Break-even Price One if debit paid: The strike price of leg two minus the maximum profit (defined below);
- Break-even Price Two if debit paid: The strike price of leg two plus the maximum profit (defined below);
- Maximum Profit: The spread between legs one and two plus the credit (or minus the debit, as the case may be);
- Maximum Loss: The spread between legs two and three minus the maximum profit (defined above) OR the debit paid, whichever value is greater
Simplistic Example Trade:
- Buy a $95 call for 8.40
- Sell two $100 calls for 4.80 each (total is 9.60)
- Buy a $110 call for 0.95
- The credit of 9.60 minus 8.40 minus 0.95 equals a credit of 0.25
- Maximum profit is the spread of 5.00 plus the credit of 0.25, which is 5.25, times 100, which is $525 per contract
- Break-even price is strike price of 100 plus maximum profit of 5.25, which is 105.25
- Maximum loss is spread of 10.00 minus maximum profit of 5.25, which is 4.75, times 100, is $475 per contract
Here is an example Payoff Analysis of this strategy, which uses different figures:
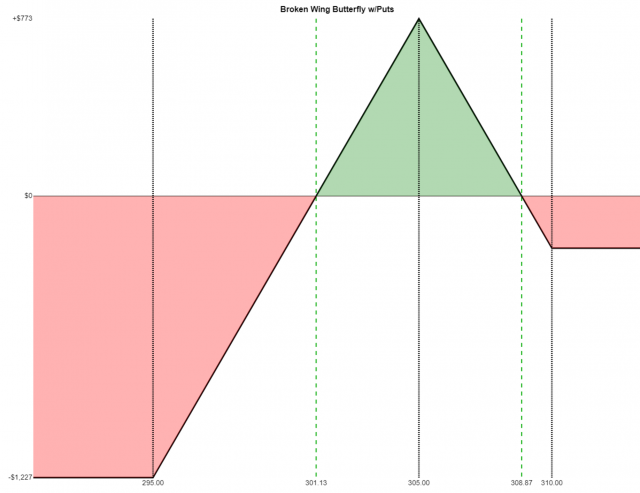
The Broken Wing Butterfly with Puts consists of a long put (at the lowest strike price), two short puts (middle strike), and a long put (at the highest of the three strike prices). It has these properties:
- Market View: Neutral;
- Opportunity: Predefined and limited;
- Risk: Predefined and limited;
- Leg One: Purchase of put at the lowest strike price (debit paid);
- Leg Two: Sale of two puts at the medium strike price (credit received);
- Leg Three: Purchase of put at the highest strike price (debit paid);
- Net Result: The credit received minus the two debits paid yield a credit or debit, depending on the option prices;
- Break-even Price if credit received: The strike price of leg two minus the maximum profit (defined below);
- Break-even Price One if debit paid: The strike price of leg two plus the maximum profit (defined below);
- Break-even Price Two if debit paid: The strike price of leg two minus the maximum profit (defined below);
- Maximum Profit: The spread between legs two and three plus the credit (or minus the debit, as the case may be);
- Maximum Loss: The spread between legs one and two minus the maximum profit (defined above) OR the debit paid, whichever value is greater
Simplistic Example Trade:
- Buy a $95 put for 0.70
- Sell two $105 put for 4.65 each (total is 9.30)
- Buy a $110 put for 8.25
- The credit of 9.30 minus 8.25 minus 0.70 equals a credit of 0.35
- Maximum profit is the spread of 5.00 plus the credit of 0.35, which is 5.35, times 100, which is $535 per contract
- Break-even price is strike price of 105 minus maximum profit of 5.35, which is 99.65
- Maximum loss is spread of 10.00 minus maximum profit of 5.35, which is 4.65, times 100, is $465 per contract
Here is an example Payoff Analysis of this strategy, which uses different figures:
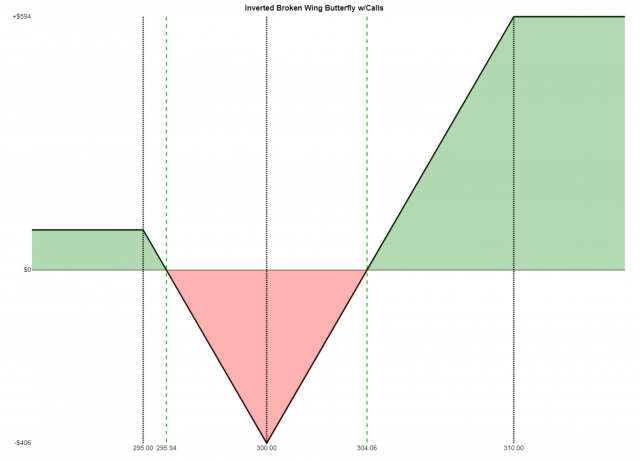
The Inverted Broken Wing Butterfly with Calls consists of a short call (at the lowest strike price), two long calls (middle strike), and a short call (at the highest of the three strike prices). It has these properties:
- Market View: Bullish;
- Opportunity: Predefined and limited;
- Risk: Predefined and limited;
- Leg One: Sale of call at the lowest strike price (credit received);
- Leg Two: Purchase of two calls at the medium strike price (debit paid);
- Leg Three: Sale of call at the highest strike price (credit received);
- Net Result: The proceeds of legs one and three minus the cost of leg two yields a credit or debit, depending on the option prices;
- Break-even Price if debit paid: The strike price of leg two plus the maximum loss (defined below);
- Break-even Price One if credit received: The strike price of leg two minus the maximum profit (defined below);
- Break-even Price Two if credit received: The strike price of leg two plus the maximum loss (defined below);
- Maximum Profit: The spread between legs two and three, minus the maximum loss;
- Maximum Loss: The spread between legs one and two minus the credit received (or plus the debit paid, as the case may be)
Simplistic Example Trade:
- Sell a $95 call for 8.40
- Buy two $100 calls for 4.80 each (total is 9.60)
- Sell a $110 call for 0.95
- The credits of 8.40 and 0.95 minus the debit of 9.60 yields a net debit of 0.25
- Maximum profit is the spread of 10 minus the maximum loss of 5.25, which is 4.75, times 100, which is $475 per contract
- Break-even price is strike price of 100 plus maximum loss of 5.25, which is 105.25
- Maximum loss is the spread of 5 plus the net debit of 0.25, which is $5.25, times 100, is $525 per contract
Here is an example Payoff Analysis of this strategy, which uses different figures:
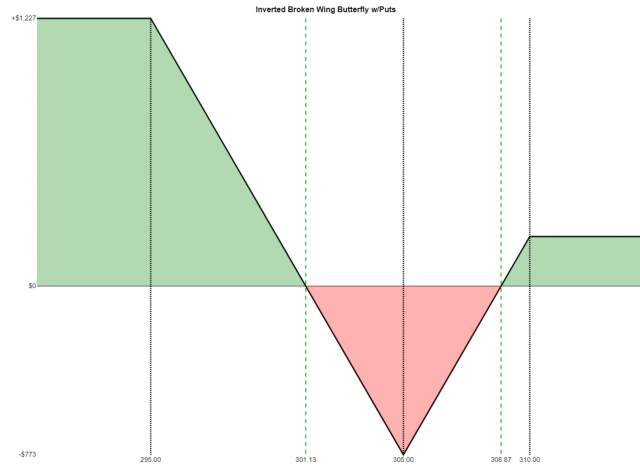
The Inverted Broken Wing Butterfly with Puts consists of a short put (at the lowest strike price), two long puts (middle strike), and a short put (at the highest of the three strike prices). It has these properties:
- Market View: Bearish;
- Opportunity: Predefined and limited;
- Risk: Predefined and limited;
- Leg One: Sale of put at the lowest strike price (credit received);
- Leg Two: Purchase of two puts at the medium strike price (debit paid);
- Leg Three: Sale of put at the highest strike price (credit received);
- Net Result: The proceeds of legs one and three minus the cost of leg two yields a credit or debit, depending on the option prices;
- Break-even Price if credit received: The strike price of leg two minus the maximum loss (defined below);
- Break-even Price One if debit paid: The strike price of leg two minus the maximum loss (defined below);
- Break-even Price Two if debit paid: The strike price of leg two plus the maximum loss (defined below);
- Maximum Profit: The spread between legs two and three minus the debit paid (or plus the credit received, as the case may be);
- Maximum Loss: The spread between legs one and two minus the maximum profit
Simplistic Example Trade:
- Sell a $95 put for 0.70
- Buy two $105 puts for 4.65 each (total is 9.30)
- Sell a $110 put for 8.25
- The credits of 8.25 and 0.70 minus the debit of 9.30 yields a net debit of 0.35
- Maximum profit is the spread of 5 minus the debit of 0.35, which is 4.65, times 100, is $465 per contract
- Break-even price is strike price of 105 plus the debit of 0.35, which is 105.35, and also minus the debit of 0.35, which is 104.65
- Maximum loss is the spread of 10 minus the maximum profit of 4.65, which is 5.35, times 100, which is $535 per contract
Here is an example Payoff Analysis of this strategy, which uses different figures:
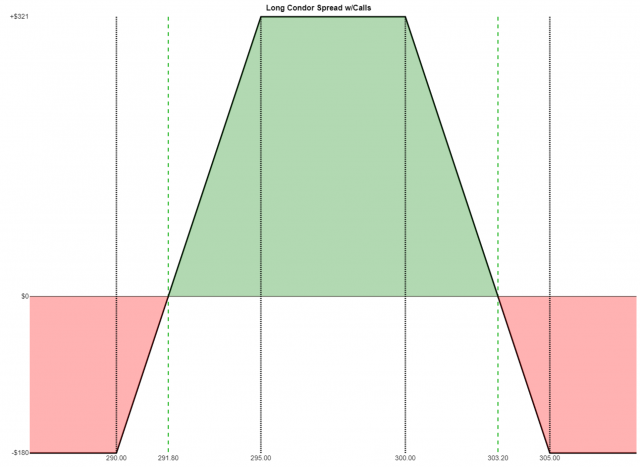
The Long Condor with Calls has the following properties:
- Market View: Neutral;
- Opportunity: Predefined and limited;
- Risk: Predefined and limited;
- Leg 1: the lowest strike price, a long call position, creating a debit;
- Leg 2: the second-lowest strike price, a short call position, yielding a credit;
- Leg 3: the second-highest strike price, a short call position, yielding a credit;
- Leg 4: the highest strike price, a long call position, creating a debit;
- Net Result: the proceeds from legs 2 and 3, minus the cost of legs 1 and 4, result in a net debit;
- Break-even One: strike price of leg 1 plus the debit;
- Break-even Two: strike price of leg 4 minus the debit;
- Maximum Profit: spread between legs 1 and 2 minus the debit paid;
- Maximum Loss: net debit.
Simplistic Example Trade:
- Buy a $95 call for $8.40
- Sell a $100 call for $4.80
- Sell a $105 call for $2.35
- Buy a $110 call for $0.95
- So there are two “credits received”. Subtract the two “debits paid” and that is net debit. In this example, (2.35+4.80)-(8.40+0.95) yields a net debit of $2.20
- Break-even price number one is 95 plus 2.20, which is 97.20
- Break-even price number two is 110 minus 2.20, which is 107.80
- Maximum profit is the spread, 5.00, minus the 2.20 debit, which is 2.80, times 100, means $280 per contract
- Maximum loss is the the debit of 2.20, times 100, which is $220 per contract
Here is an example Payoff Analysis of this strategy, which uses different figures:
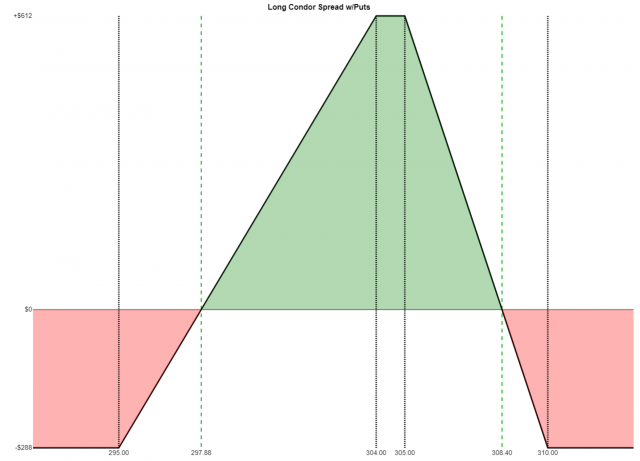
The Long Condor with Puts, which combines a long put spread with a short put spread of equal widths, has the following properties:
- Market View: Neutral;
- Opportunity: Predefined and limited;
- Risk: Predefined and limited;
- Leg 1: the lowest strike price, a long put position, creating a debit;
- Leg 2: the second-lowest strike price, a short put position, yielding a credit;
- Leg 3: the second-highest strike price, a short put position, yielding a credit;
- Leg 4: the highest strike price, a long put position, creating a debit;
- Net Result: the proceeds from legs 2 and 3, minus the cost of legs 1 and 4, result in a net debit;
- Break-even One: strike price of leg 1 plus the debit;
- Break-even Two: strike price of leg 4 minus the debit;
- Maximum Profit: spread between legs 1 and 2 minus the debit paid;
- Maximum Loss: net debit.
Simplistic Example Trade:
- Buy a $95 put for $0.70
- Sell a $100 put for $2.10
- Sell a $105 put for $4.65
- Buy a $110 put for $8.25
- So there are two “credits received”. Subtract the two “debits paid” and that is net debit. In this example, (4.65+2.10)-(0.70+8.25) yields a net debit of $2.20
- Break-even price number one is 95 plus 2.20, which is 97.20
- Break-even price number two is 110 minus 2.20, which is 107.80
- Maximum profit is the spread, 5.00, minus the 2.20 debit, which is 2.80, times 100, means $280 per contract
- Maximum loss is the the debit of 2.20, times 100, which is $220 per contract
Here is an example Payoff Analysis of this strategy, which uses different figures: