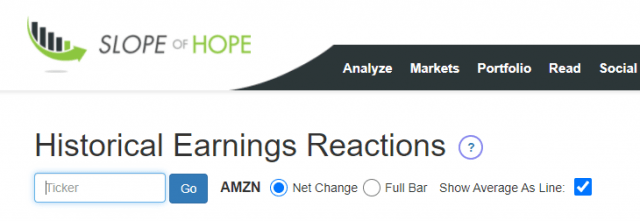
The Earnings Reaction Graph is an exclusive feature for Platinum members (to learn about Slope memberships, click here). This page presents to you all the historical reactions from company earnings announcements.
Once you are at the page, all you have to do is enter a ticker symbol and click Go (or press the Return key). By default, the stock ticker AMZN is entered for you.
When you enter a ticker symbol, you can see the immediate reaction a given stock had during all of its prior earnings periods from longest ago (left side) to most recent (right side). The black line is the average of all of them, and you can turn this black line on and off with a checkbox. Also, you can point to any one of these bars to see the date of the event and the percentage-based price reaction. This tool is especially helpful to options traders.
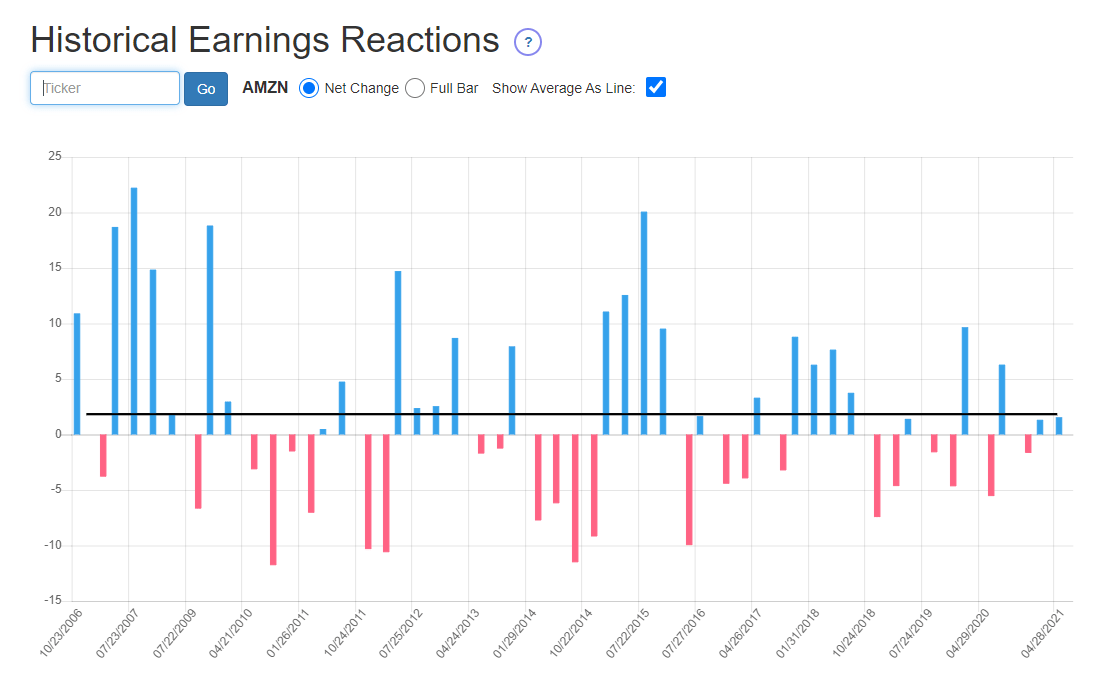
There are actually two modes to display these reactions, however. One of them, Net Change, is the default, and it succinctly shows you the net percentage change at the end of the day following the announcement.
If you click the Full Bar radio button, however, you will see the information presented in a different way:
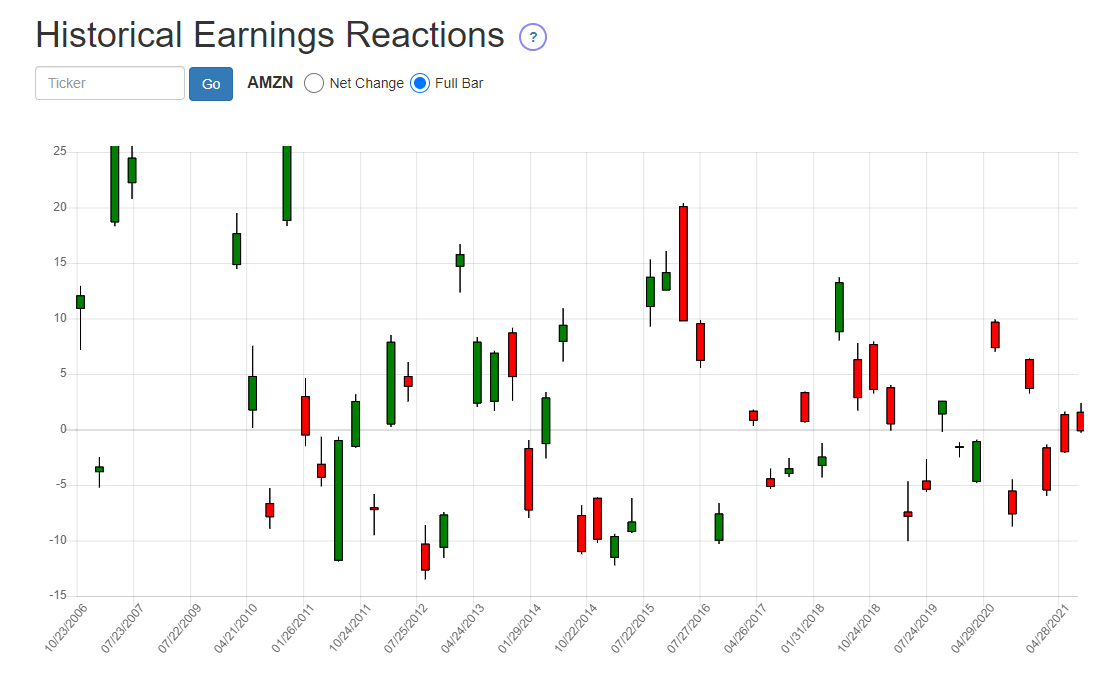
Specifically, you are seeing the entire day’s bar, in percentage terms, following the earnings announcement. So instead of seeing just one data point (the net percentage change of the closing price) you are seeing four (the percentage change for the open, high, low, and close for the entire trading day). This might be a more desirable presentation of the information for you since it is more complete.

Note that whereas in the first mode, red and green indicate a loss or a gain, the colors in the other mode are instead representing whether the close price was higher than the open (green bar) or lower (red bar).
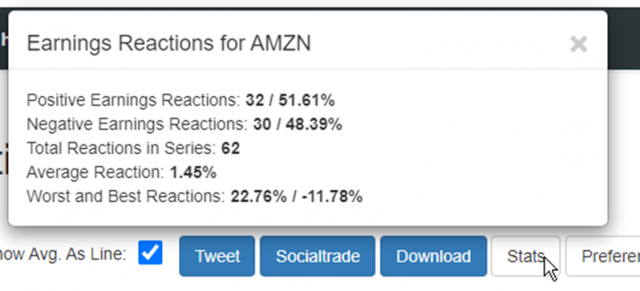
This page also features a button called Stats.
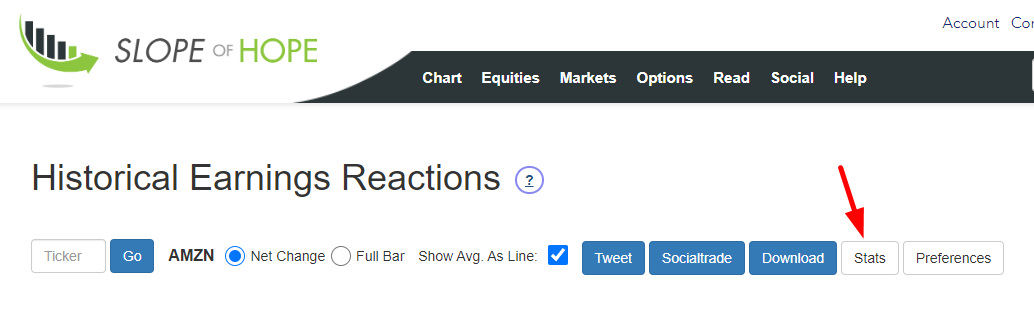
When you click it, a new window appears for whatever symbol you are already observing (the default being AMZN). It provides a wealth of useful information:
- How many instances of positive reactions there were, and what percentage of the entire set that represents;
- How many instances of negative reactions there were, and what percentage of the entire set that represents;
- The grand total of reactions for which we have historical data (typically this is how many quarters exist for a given stock);
- The average reaction to earnings, whether positive or negative;
- The most extreme positive and reactions for the entire data set.
Here is another example, which time using Tesla:
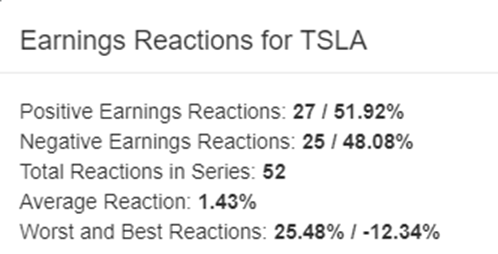
This is an entirely novel way to examine the whole of a stock’s relationship with its earnings events to give you a better sense as to the personality of a given instrument on its important quarterly earnings day.
