SlopeRules is a feature in SlopeCharts which lets you create a trading system using discrete technical rules for entering and exiting positions. It is deliberately designed to be intuitive and very simple to use, and it is closely integrated with the SlopeCharts platform.
To create a rule set, choose Create SlopeRules from the Rules menu within SlopeCharts. (If you don't have an account yet on Slope of Hope, sign up here to get one so you can use the charts. It's free.) The Rules menu is where the SlopeRules selections are available. You can also get to these by right-clicking anywhere in SlopeCharts.
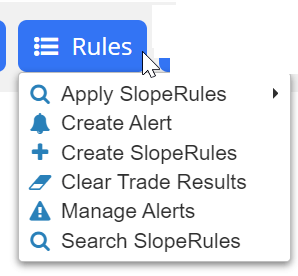
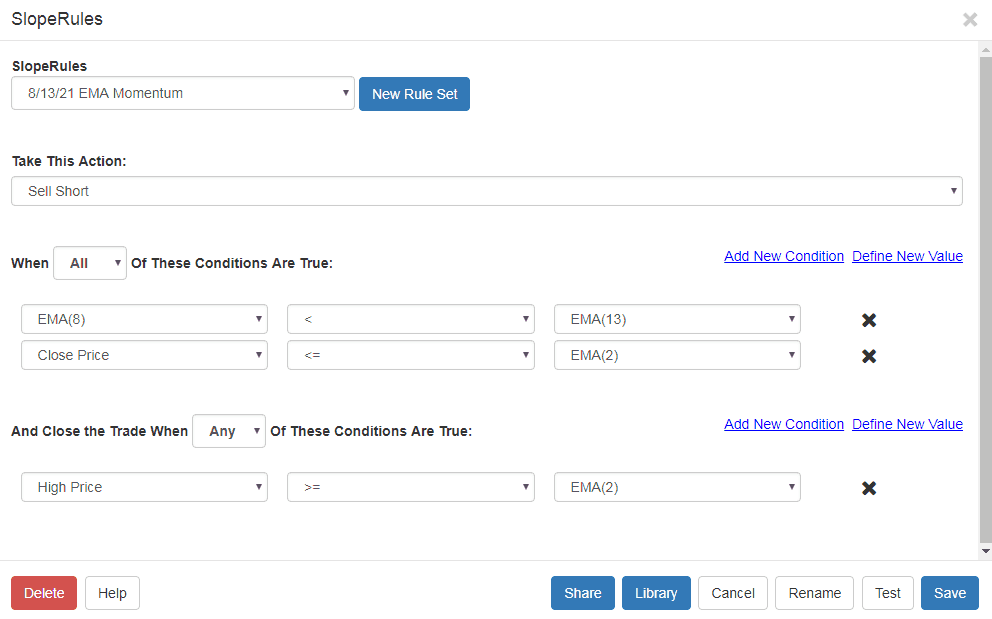
Once you choose Create SlopeRules, you will be presented with a dialog box with the following components:
- SlopeRules dropdown menu: this has the names of all the SlopeRules you have made already, if any. You can select any prior SlopeRules, or you can click the New Rule Set button if you want to make a new SlopeRules set of parameters;
- Take This Action: a dropdown which is either Buy Long or Sell Short;
- Opening Conditions: this is where you establish the conditions which will open a hypothetical trade;
- Closing Conditions: this is where you establish the conditions which close a hypothetical trade.
The most important component of the dialog box is, of course, the rules themselves. Each rule you create is a simple condition which is either True or False, such as whether the 50-day simple moving average is above the 200-day simple moving average, or whether the Closing Price of a security crosses beneath the 200-day exponential moving average.
By experimenting with different combinations of rules, you can learn what kinds of trading systems appear to produce better results than others.
Creating a rule set in SlopeRules first requires you decide whether you're going to create rules for buying ("Buy Long" on the dropdown) or shorting ("Sell Short" on the dropdown). You then establish conditions for what constitutes the opening of a trade.
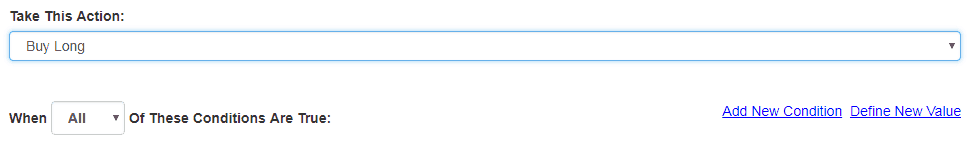
There are no conditions at first. To create the first condition, click on the Add New Condition hyperlink, and a blank rule appears that looks like this:

The choices available on the left and right dropdowns are identical: they consist of prices (Open Price, High Price, Low Price, and Close Price, the last of which is most commonly used) and indicators (such as CCI, Williams %R, and so on). The dropdown in the middle gives you different ways to compare the left and right values. The idea here is to make something resembling a sentence, such as:
- Closing Price Crosses Above SMA(50)
- SMA(50) Crosses Below SMA(100)
- RSI(14) Crosses Above 30
You can create as many of these conditions as you like, but you must have at least one condition. There is one other important decision to make, which is in the form of this tiny dropdown:
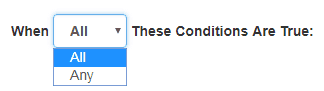
This dictates whether a hypothetical opening trade will be executed if any of the conditions are met, or if and only if all the conditions are satisfied. This is a critically-important distinction, since "All" will tend to be far more constraining than "Any".
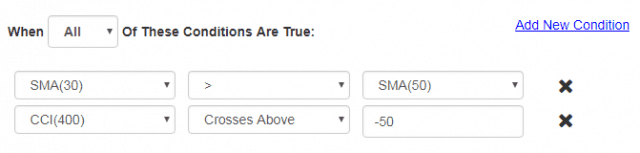
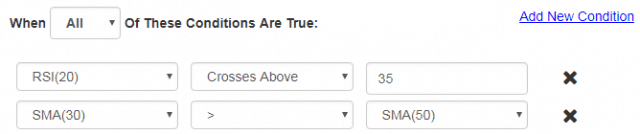
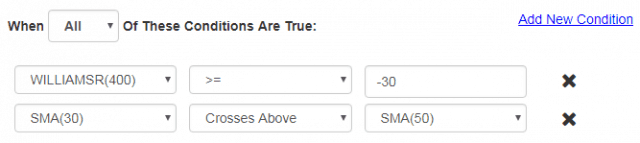
Here are a few examples of Opening conditions:
You may want to create your own custom value instead of using one of the predefined ones. Choose “Define New Value” from the SlopeRules dialog box.....
....and this will appear:

It is here you can create your own custom rule. For example, you create a 225-day exponential moving average, you would:
- Choose “Moving Average” as the Value Type;
- Choose “Exponential’ as the Type;
- Slide the slider bar until you got to 225 (if you need to nudge the value lower or higher , you can use the left and right arrow keys on your keyboard to fine-tune the number);
- Click Save, and that new definition will be immediately available.
If the rule you are building uses an item that needs to be compared to a number, such as Williams %R or RSI, then the right dropdown will allow you to just type in the number directly. Otherwise, you can compare one technical indicator to another technical indicator.
There is another very important feature here known as Optimize, which is a powerful component of SlopeRules. The optimization is now automatically applied in SlopeRules.
When you create a new value – – that is, a “rule” – – for SlopeRules, you may or may not have an idea what parameter to use. For instance, when you go to create a moving average parameter, you probably do like most people and use some nice, round number that you’ve seen before, like 50, 100, or 200.
We’ve brought something new to this by doing the “thinking” for you in advance. Now you get the optimal value for any of these studies. Of course, you can still use whatever value you decide, but SlopeRules automatically suggests an optimal value to you based on our own historical calculations.

Although the symbol entry will default to whatever symbol is on your chart, you can change the symbol used for optimization to be anything. The default dropdown is “All”, which means both long and short trades, although you can change this to your liking. You can use the Optimize function on other indicators as well. The point of this is that we have put our processing power to work in advance for you in order to calculate what appear to be the most effective parameters based on historical performance.
Establishing closing conditions is identical to opening conditions. As before, there are no conditions at first. To create the first condition, click on the Add New Condition hyperlink, and a blank rule appears that looks like this:
The choices available on the left and right dropdowns are identical: they consist of prices (Open Price, High Price, Low Price, and Close Price, the last of which is most commonly used) and indicators (such as CCI, Williams %R, and so on). The dropdown in the middle gives you different ways to compare the left and right values. The idea here is to make something resembling a sentence, such as:
- Closing Price Crosses Above SMA(50);
- SMA(50) Crosses Below SMA(100);
- RSI(14) Crosses Above 30
You can create as many of these conditions as you like, but you must have at least one condition. There is one other important decision to make, which is in the form of this tiny dropdown:
This dictates whether the hypothetical trade will be closed if any of the conditions are met, or if and only if all the conditions are satisfied. This is a critically-important distinction, since "All" will tend to be far more constraining than "Any". It is especially useful for closing conditions, and an example will help clarify this.
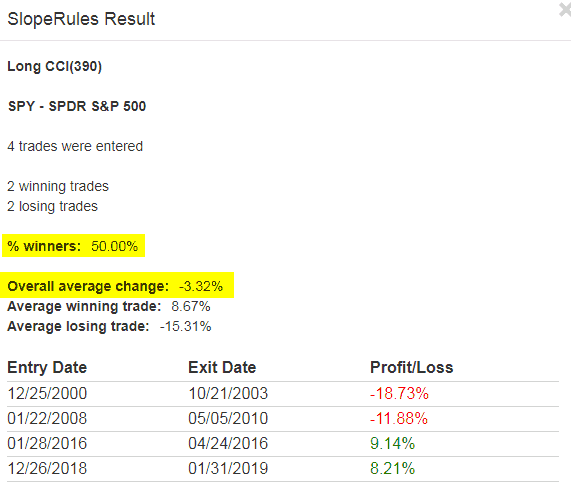
Let's put together an extremely simple system for buying stocks based on the CCI indicator. Entry when it crosses above -100 and exit when it crosses below +100:

The results are nothing special. Four trades, two of which are winners and two losers. Overall change across the four trades: -3.32%. It's a simple, and lousy, system.
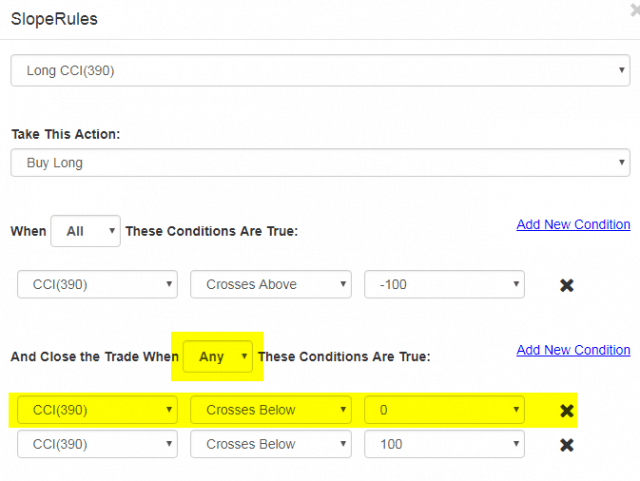
Now let's add one rule which will "force exit" the trade. We will add a new exit criteria which will be triggered if the CCI goes below 0. In other words, if it starts climbing, gets above 0, and then sinks beneath 0, the trade will instantly be exited. Take note that we've selected the ANY from the dropdown, but any of the conditions (of which there are only two) for a close will be sufficient.
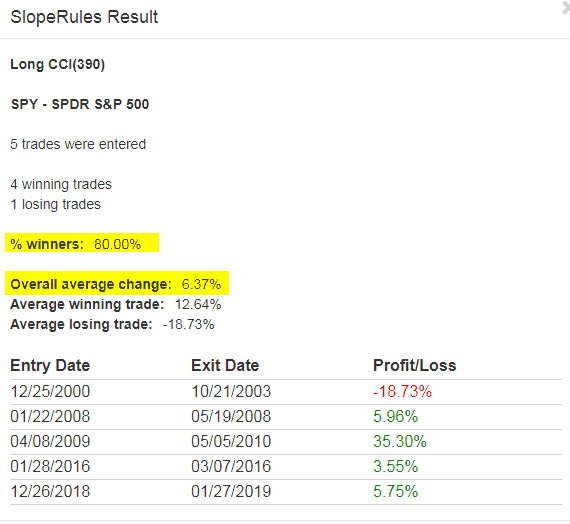
How does this change the results? Well, there are five trades now, but four of them are winners and just one is a loser. More importantly, 80% of them are winners, and the overall change is +6.37%. Quite an improvement!
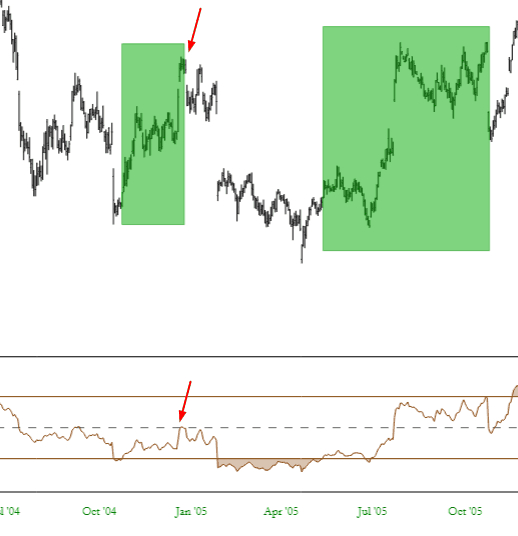
The zoomed-in portion of the chart below shows how a simple "escape valve" like the rule above can help a system dodge the proverbial bullet. Notice how the trade was closed before the stock started really sinking badly.
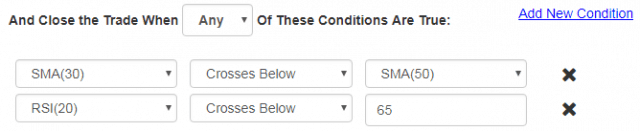
Here are a few examples of closing conditions:
There are several special choices for closing a position: the percentage profit and loss on a trade, as well as the maximum drawdown. In other words, you can declare in your rule set that a hypothetical position be closed the moment it reaches a certain percentage profit (% Profit on Trade) or closed the moment it suffers a certain percentage loss (% Loss on Trade) or closed after it descends a certain amount from its price peak (% Drawdown from Peak).
The point is that you can create a system in which you protect yourself from runaway losses and dictate how much profit is acceptable to you without getting too greedy.

So let’s add one simple rule to the SlopeRules used to produce the AMZN trades above. This new rule will simply say that, for any given trade, if the price goes 2% or more below our entry, we will close it at once.

Now the overall charge is 9.7%, an improvement of over 3%, because the average losing trade (tinted in magenta) has been reduced. We have easily improved the performance of our rule set merely by limiting losses. Thus, you have a way to more precisely articulate your own goals and risk comfort level in SlopeRules, making the product more useful and realistic.
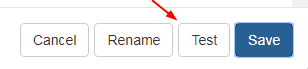
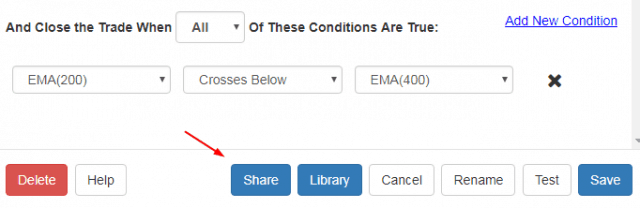
Before you save a set of SlopeRules, it is best to Test it. You should continue adding, deleting, and modifying conditions until you are satisfied with the results, and those results are made possible quickly by the availability of a Test button right inside the dialog box.
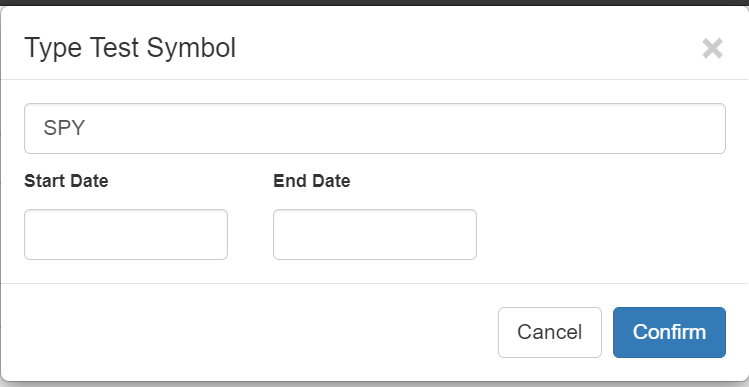
After you click it, you will be presented with a dialog box allowing you to subject any particular symbol to your SlopeRules. It will automatically have the symbol of whatever chart you were looking at, but you can change this to a different symbol if you like before you click the OK button.
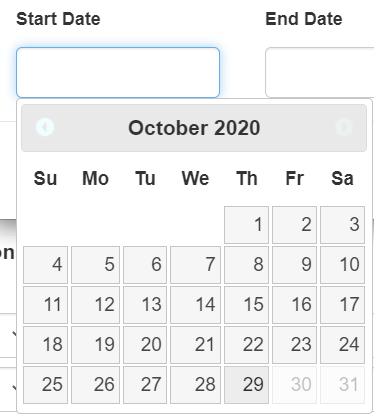
You also have the opportunity to bound the test period with a specific Start Date and End Date. If you leave these blank, all available data will be used. Otherwise, you can use the Calendar tool that appears when you click either of these fields and enter your desired dates.
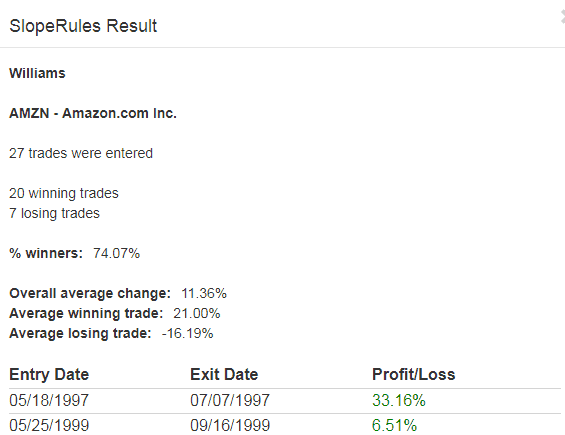
In a couple of moments, the results of your test will be displayed. It will show the name of the SlopeRules being used, what symbol was used, how many trades were executed, how many of those were winners and losers, and various kinds of percentage results data. It will also show you the individual trades and their returns.
Once you are satisfied with the results of your testing, click Save and give your SlopeRules a name. You might want to name it in such a way as to describe the nature of the ruleset.
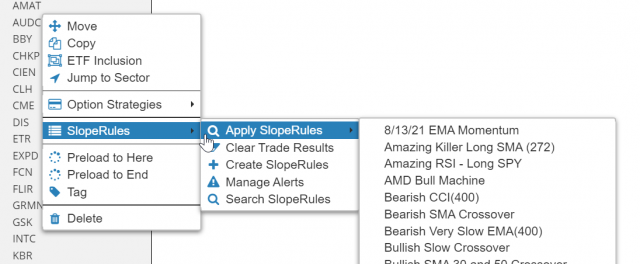
As a component of the SlopeCharts system, SlopeRules is tightly-integrated to its parent product. To apply SlopeRules to a specific symbol for testing, right-click on any symbol in your watchlist and choose which specific rule set you want to apply.
Your rules will be applied to the entire history available for whatever security you selected, and the outcome will be shown in a Results dialog box. You will see the total number of trades, how many winning and losing trades there were, what percentage of trades were winners, and what their respective and average percentages were. You will also see the entry and exit dates as well as the Profit/Loss for each one. The name of the rule set and the symbol you are using is also shown at the top for the sake of clarity.
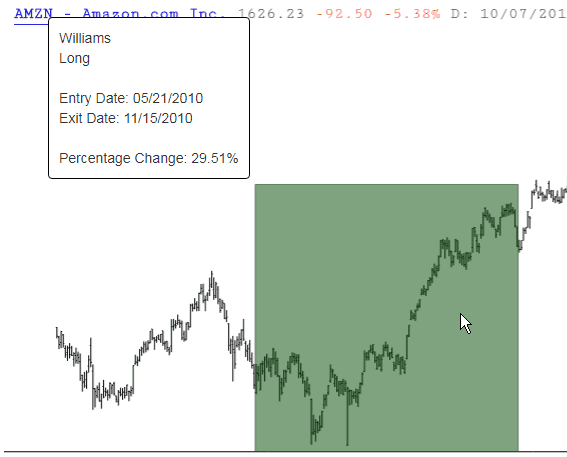
You will also be presented with all the trades in graph form, shown as rectangles drawn directly on top of the chart. For profitable trades, these are shown as green rectangles, whereas losing trades are in red. This lets you get a sense as to how good your rules are, since you want a rule set that maximizes profit without missing too many opportunities. When you hover your mouse over any given rectangle, the details of that specific hypothetical trade will be shown.
If you want to preserve any of the “trade rectangles”, right click on it and choose “Keep This” and it will be retained like any other drawn object. When you want to erase all the trade rectangles from the chart, just right-click the symbol in the watchlist again and choose:
![]()
Let's take a step-by-step example as to how a SlopeRules set would be constructed and improved.
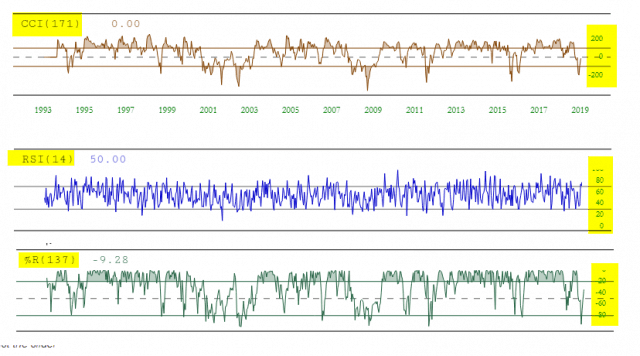
When basing rules on indicators, it's important to know which levels and crossover points are important to different indicators. Below, for instance, are some examples of the CCI, RSI, and %R indicators. As you can see, the y-axis values (highlighted on the right) vary quite a bit from study to study.
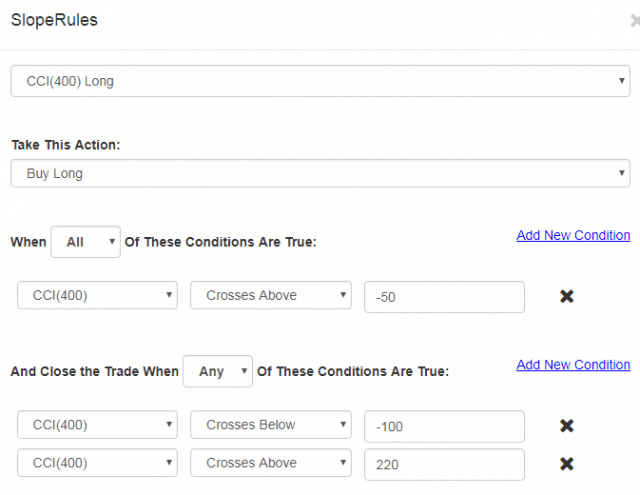
So let's make a bullish SlopeRules set with the CCI specifically. In order to have a small, tidy set of "hits" for this example, we'll use a very slow CCI with the largest number available for its calculation: 400. So within SlopeCharts we would:
- Choose the SlopeRules item from the Tools menu;
- I would construct the CCI(400) value by way of the New Value link. I would then add one rule for entering a position (the CCI crossing above the level -50).
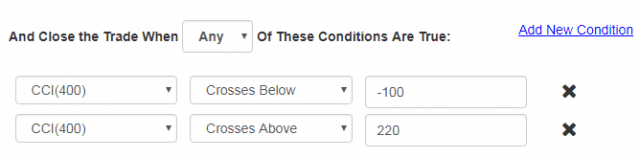
- Add two rules for exiting a position, both of which also use the CCI(400). One of them is for values above 220, suggesting a powerful move higher. The other is for values crossing below -100, meaning the stock is rolling over and not doing well, thus exiting the trade. Importantly, the "Any" is chosen so that either of these rules will trigger an exit.
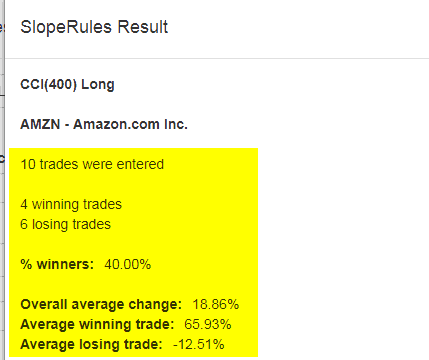
Clicking on the Test button and entering AMZN as the test symbol, we get the results below. There are ten trades, 40% of which are winners. The average winning trade is about five times bigger than the average losing trade, so overall the average change per trade is pretty good: 18.86%.
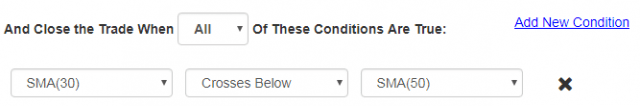
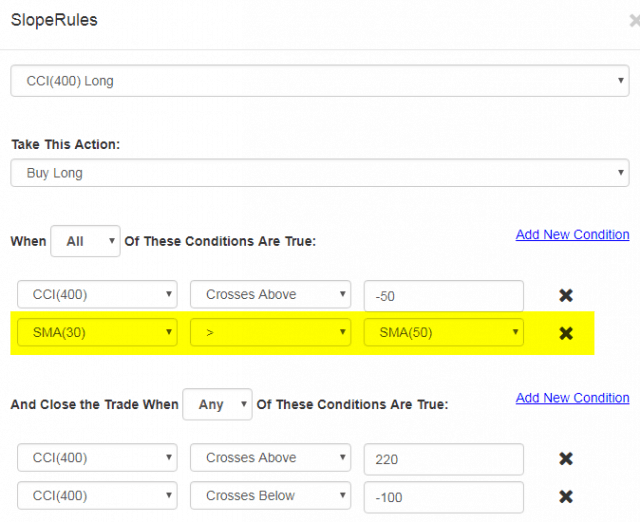
However, let's refine this a little in order to execute trades when the stock is in an uptrend. This will reduce the number of trades but might filter out some of the losers. So we add another rule, highlighted below, which requires that the simple 30-day moving average value be higher than the 50-day moving average value (indicating the stock is generally trending higher).
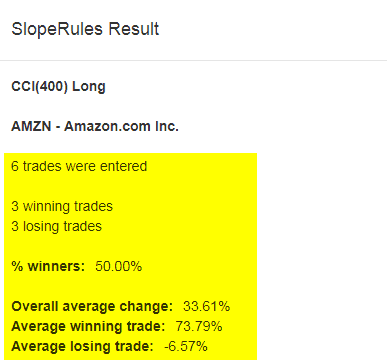
Using the Test button on AMZN once again, we get different results. Only six trades were executed. Half were winners, half were losers. But notice how much the overall average change has improved: it's up to 33.61%, nearly double the prior amount. This was accomplished with just one simple extra rule.
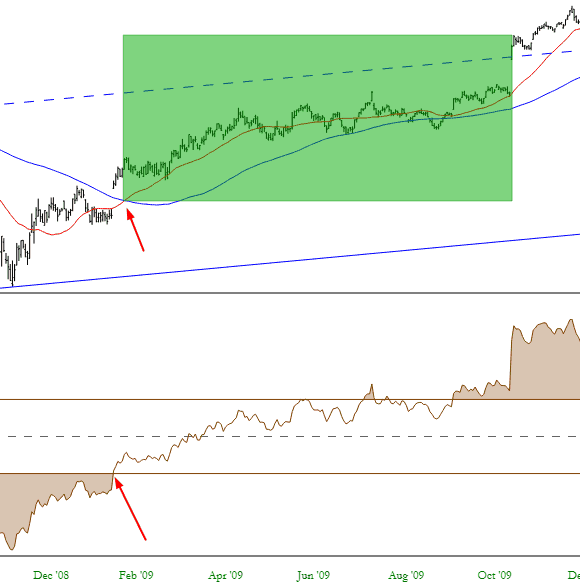
Examining the SlopeChart for AMZN shows each trade highlighted with a green rectangle. Looking at one of these closely, you can see how the entry was made when both criteria were satisfied. Once the CCI went above 220, the trade was exited with a healthy profit.
The notion of "sharing" in SlopeRules is like a two-sided coin. You can share any SlopeRules set you've created with the entire community of Slopers. You can also, on the flip side, copy any SlopeRules which others have made public. The community as a whole contributes to the rule sets available and, over time, can help each other build out superior algorithms.
It all begins with a single button at the bottom of the SlopeRules dialog box: Share. Clicking this permits you to share the selected SlopeRules with everyone else on the Slope of Hope (It should be noted that the companion button, Library, provides an instant view to all the shared rule sets that have been made available by others).
After you click Share, a dialog box appears asking you to provide a description of the rule set. It is not required that you fill this out, but it is often helpful to provide information about the thinking behind your creation, since the name alone is rarely descriptive enough. Once you are ready to publish the selected SlopeRules, click Done.
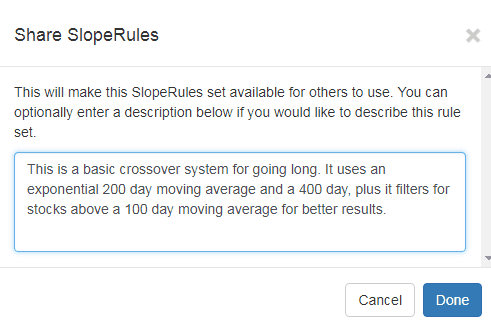
At that point, that one specific SlopeRules set is visible to others on the system. It is important to note that others cannot alter your SlopeRules. They can only copy its definition at the time you published it. Afterward, they may modify their own copy at their discretion, leaving your original SlopeRules undisturbed.
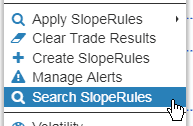
To see the library of SlopeRules, you can either click the Library button (mentioned above) or right-click anywhere on SlopeCharts and choose the Search menu item (you can also choose Search SlopeRules from the website's Develop menu, which will go to the same place):
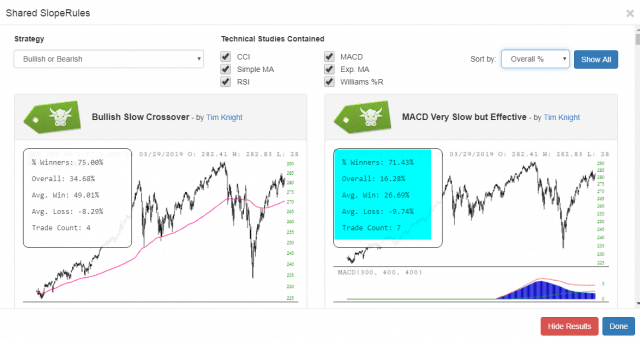
Once all the shared SlopeRules are loaded, which takes a few moments, you will be presented with all of the "tiles" - - each one represented a SlopeRules set - - arranged in order of their names. Scroll up and down through the tremendous library your fellow Slopers have created and shared.
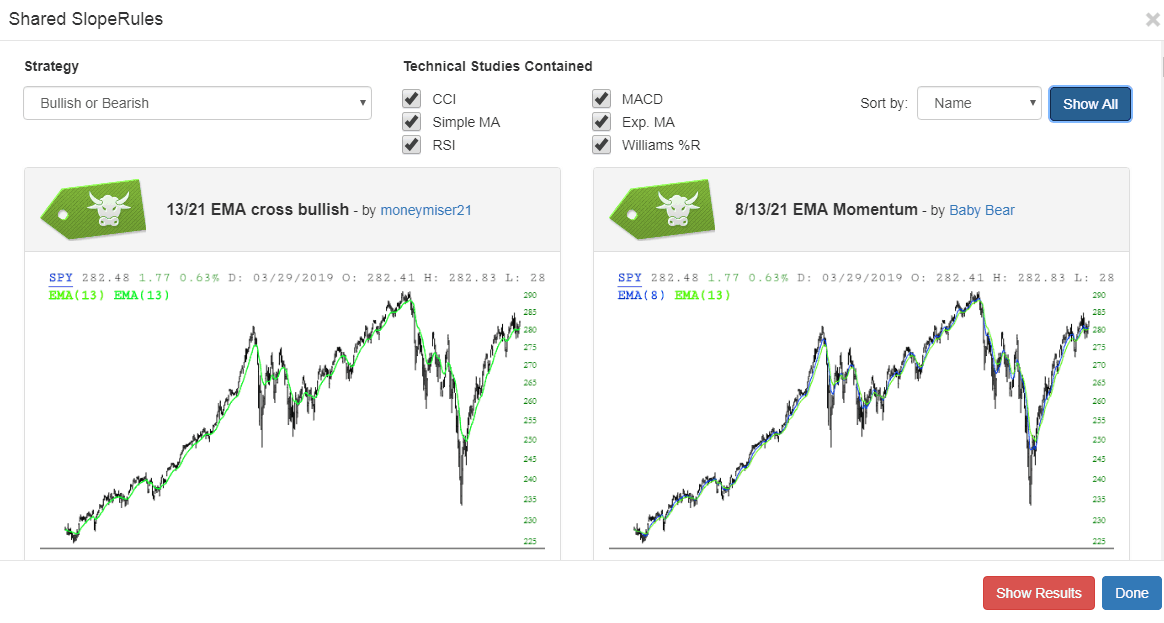
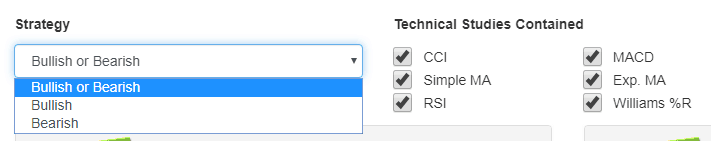
In the upper portion of the dialog box is a dropdown and a series of checkboxes that allow you to specify the parameters, if any, you would like to use to filter the search results. At first, all the shared SlopeRules are shown, but you can choose either bearish or bullish strategies, and you can decide what combination of technical indicators included in the rule sets are of interest to you.
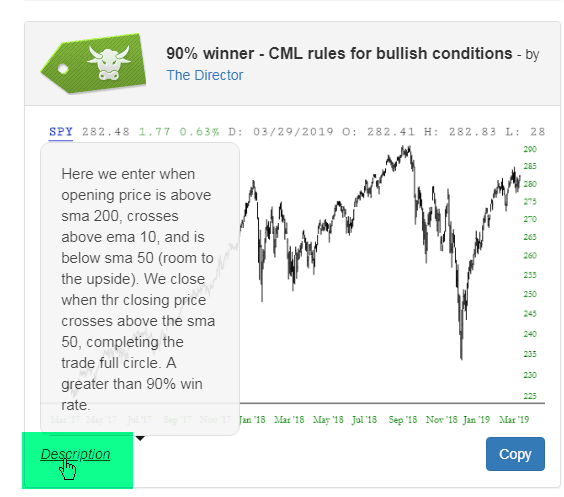
Each tile has the word "Description" in its lower left corner. If you just point the mouse to this word, a description (if any was provided) of the rule set will appear immediately. You can also click the Copy button if you want to copy that rule set into your own personal database (unless it is your own SlopeRules, in which case the button will instead read Unpublish).
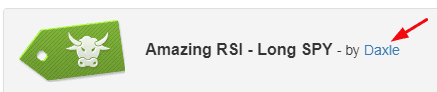
If you are curious about the author of any particular SlopeRules, you can click on their hyperlinked named and have their profile appear.
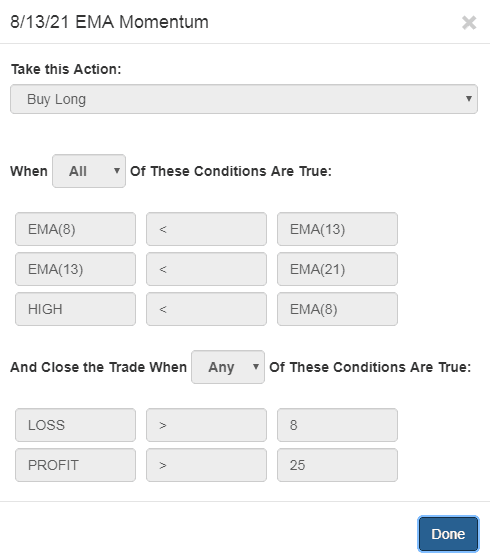
Although the name and description of any given tile will give you a good sense as to its constitution, you can also click on the tile itself and immediately get a rule-by-rule breakdown of the components therein.
In the lower-right corner is a large red button of special importance: Show Results will let you calculate the performance of all the rules based on any valid symbol you enter.
If you click Show Results, this dialog box appears allowing you to enter a symbol. It will default to whatever symbol is already on your chart (if any), but naturally you can enter something different if you'd rather study the results based on a different symbol.
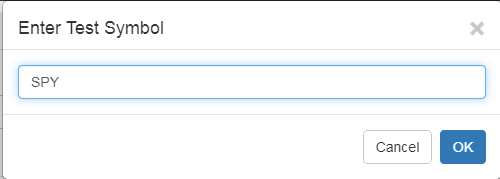
Once you enter the symbol, after a few moments of processing, each tile will be overlaid with information about its percentage of winners, its overall winning percentage, the average win percent, the average loss percent, and the total number of trades executed.
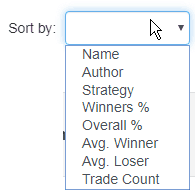
What's really interesting at this point is that you can sort all the tiles based on any of the criterion shown in the dropdown. This "Sort" dropdown is available at all times, but until you use the Show Results function, only the Name, Author, and Strategy are available as the basis for sorting. Once results are shown, however, you have many other useful choices.
Lastly, if you'd like to clean up the display, you can click Hide Results to remove that information (the same button is used; its text and function simply toggle back and forth).
The ability to share and copy SlopeRules within the Slope of Hope community provides everyone a better opportunity to both learn and profit.
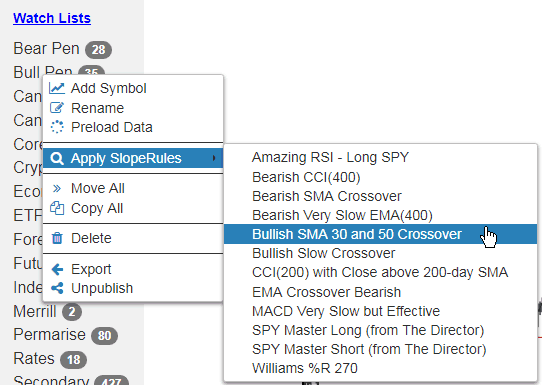
You can apply a SlopeRules set to the entire contents of a watchlist with just a couple of mouse clicks. First, right-click on the watchlist you would like to test, and then choose the particular SlopeRules set you want to apply:
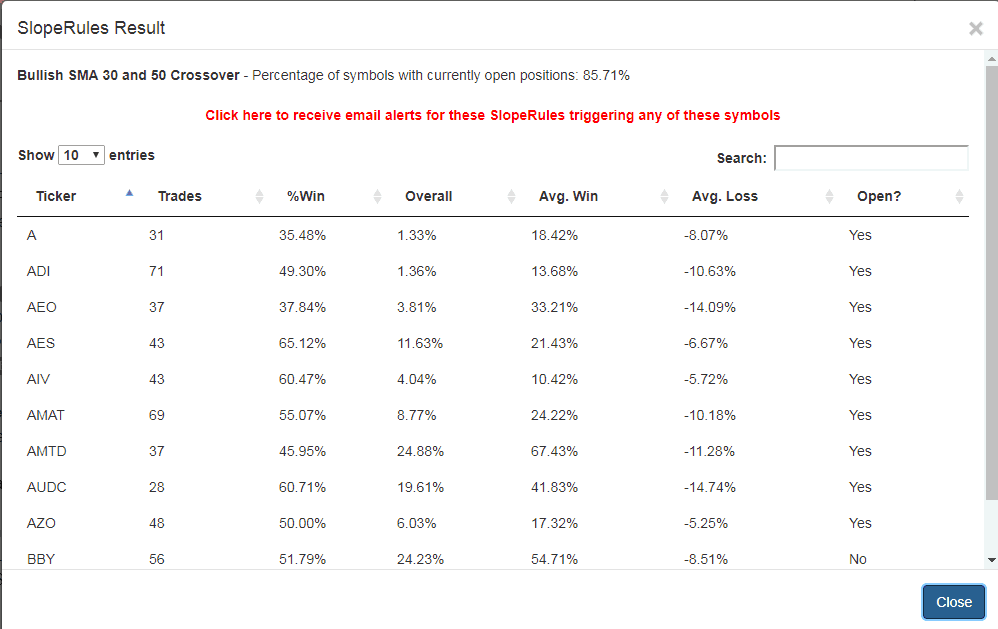
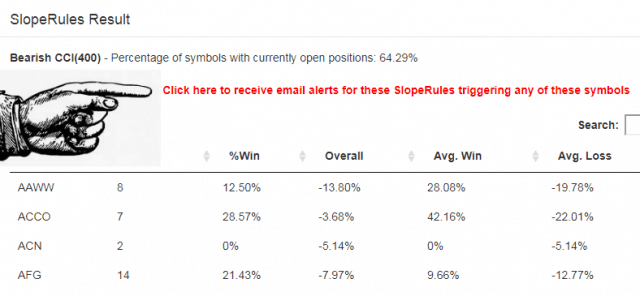
The system will then apply the SlopeRules to the entire history of each symbol within that watchlist (if the list has a lot of symbols, it could take a while to complete the processing). When it is done, you will be presented with a sortable, searchable results list, packed with information about the success of this particular rule set for each and every symbol. There will also be a prominently-featured hyperlink you can click if you want to get alerts in the future about any fresh "triggers" that take place.
There are a couple of methods you can use to be alerted to signals generated by SlopeRules.
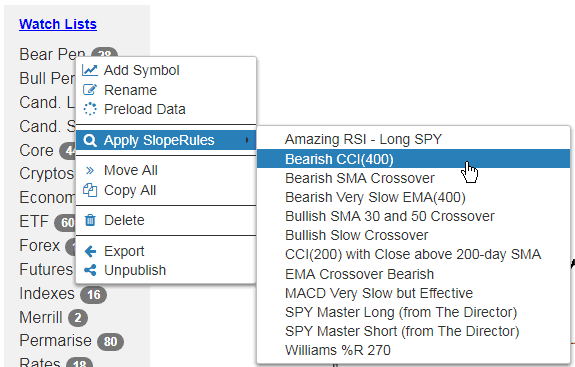
The first is after you perform a test against a single watchlist. In order to create an automatic alert from Slope about any of your symbols which are "triggered" by a SlopeRules rule set, start by choosing the watchlist you want to monitor. Right-click on the watchlist, and choose which SlopeRules in your library that you would like to apply.
It will take a while for our systems to process the entire history of each of your symbols through whichever SlopeRules you selected. The bigger the watchlist, the longer it will take. Once it is done, however, you will be presented with the test results list, and at the very top you will see a boldfaced red notification like the one shown here:
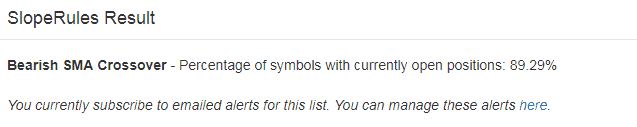
As stated, just by clicking that hyperlink, you will tell our servers to run the selected SlopeRules against the selected watchlist and email you with any triggers. The notification instantly changes to indicate that you are now monitoring that watchlist.
At the end of each trading day, our servers will use the updated data for all the watchlists and SlopeRules you have selected and will submit to you an email that tells you the symbol, the rule name, the action (whether an Open or Close) and direction (whether Long or Short) which has been triggered. You are also provided a chart hyperlink which, if clicked, will present to you that chart of that symbol with all the trades highlighted based on that particular SlopeRules set.
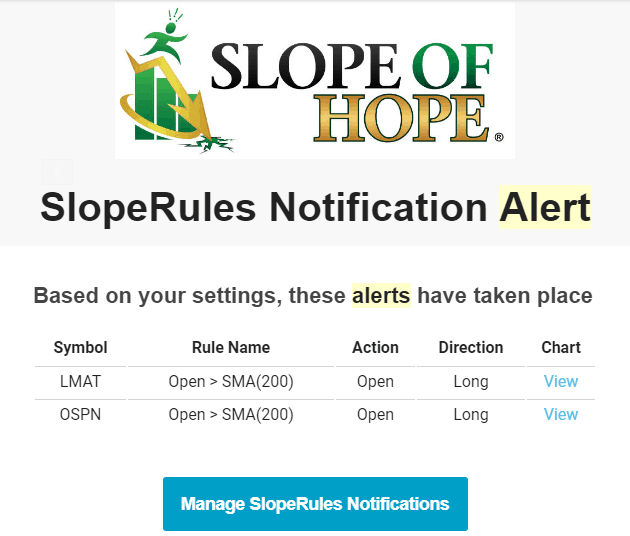
You may decide in the future to cease following some of these SlopeRules, and you can manage the list from your own Accounts page (which is also referenced via the blue button shown in the email above). You will see a button on the Accounts page like this:
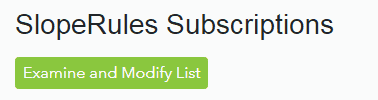
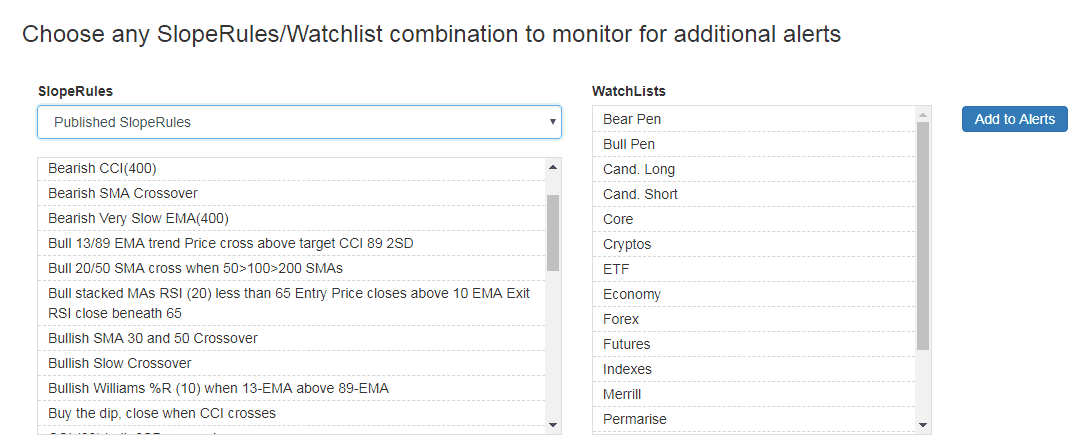
This button, if clicked, will present to you a customized page like the one below showing the SlopeRules/Watchlist combinations you are using, giving you the opportunity to click Delete for any of them.
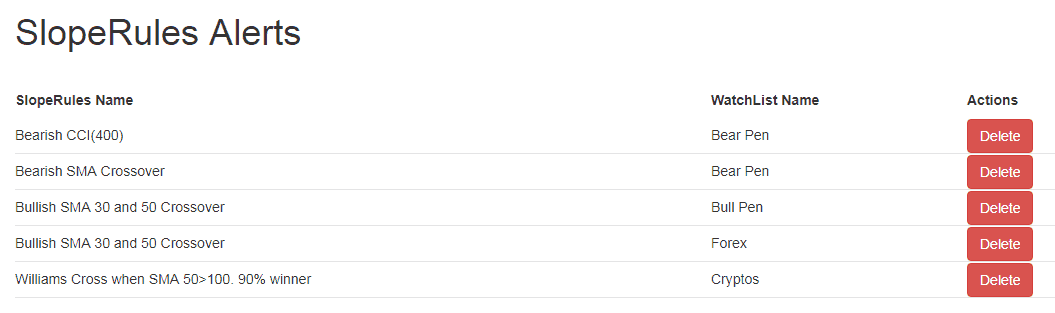
If you already know which watchlists you would like monitored by SlopeRules, you can do so directly by going to the SlopeRules Alerts page here. On this page, you can choose any SlopeRules set (either your own or one published by a fellow Sloper) and match it with a watchlist. Once you have picked a pair, click the Add to Alerts button, and that will be added to your monitored SlopeRules.