This feature allows you to create any combination of symbols, parentheses, arithmetic operators, and digits to concoct yourself a totally unique chart. It is available to Gold and Platinum users. You can upgrade your membership to get immediate access by clicking here. If you would prefer to watch a video about this feature instead of reading the content below, click here.
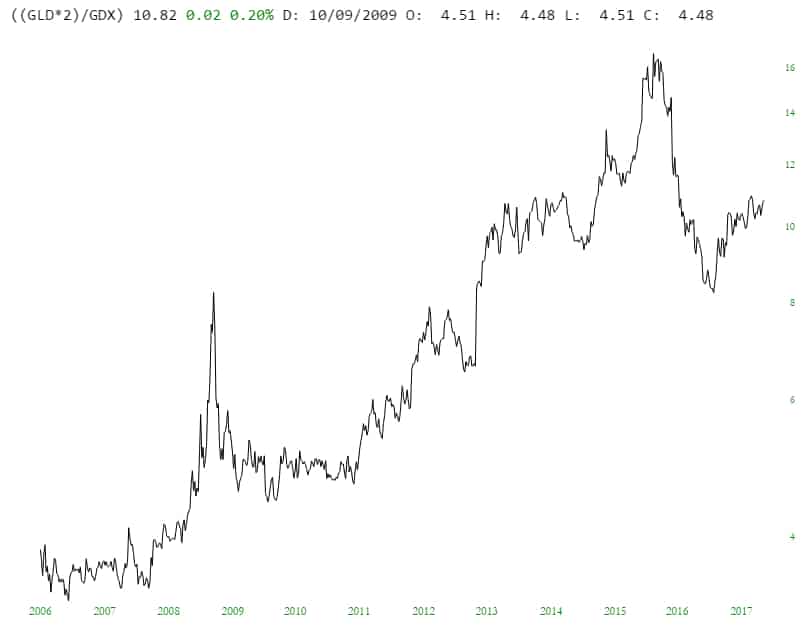
Using the Custom Symbols feature is easy. Let’s say you wanted to plot what two times the GLD fund divided by GDX (the miners) looked like – – you would just type in ((GLD*2)/GDX), and voila………

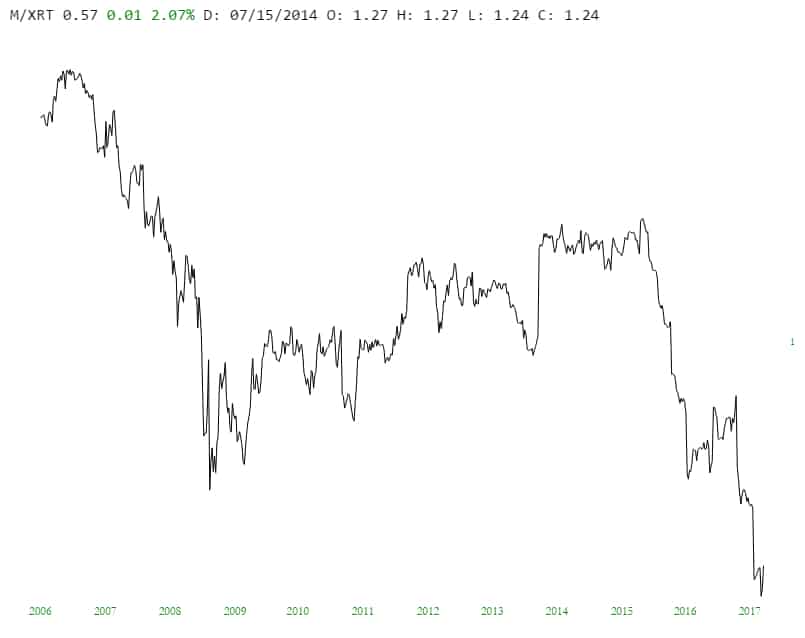
Or maybe you wanted to see how Macy’s was doing relative to retail as a whole (answer: not so great):

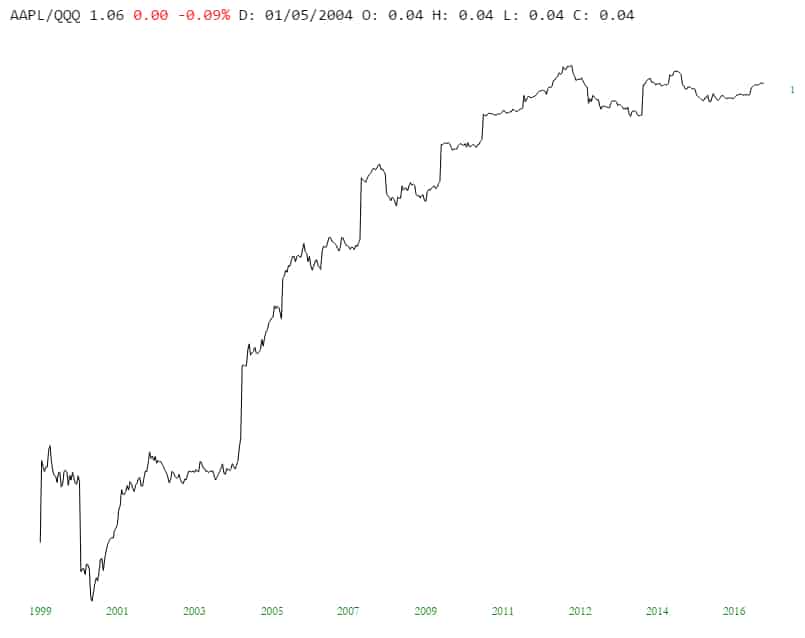
Or perhaps Apple versus the NASDAQ 100 “cubes”………..

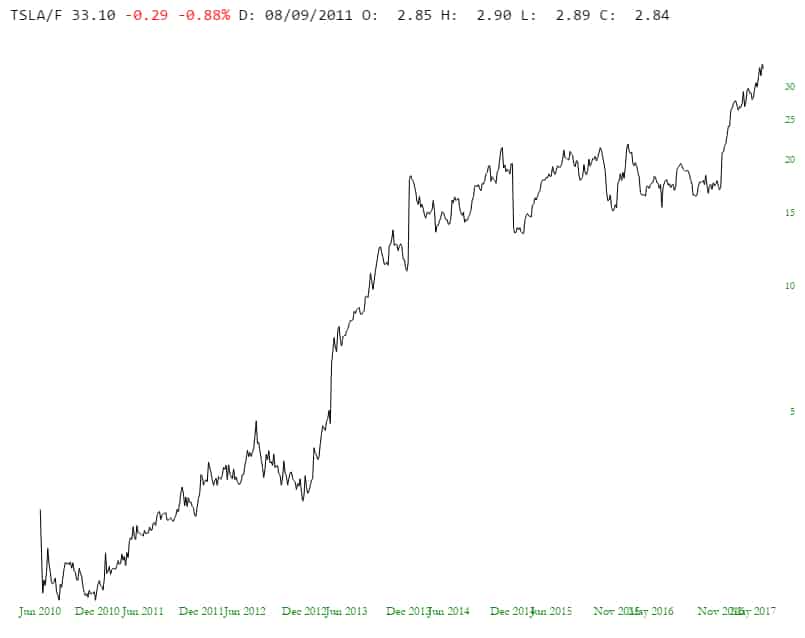
One last example – – Tesla’s stock price versus Ford’s:

So, again, you can use any of these characters to construct a symbol:
- Any equity or index symbols
- Any basic arithmetic operators (+, -, *, /)
- Real numbers (5, 12, 50, etc.)
- Parentheses
