SlopeCharts provides a number of ways to augment charts with text. In the past, the only way to do this was via the highlighting tools, which allowed for optional text notations. Now, however, there is a dedicated Text tool which you can access via this icon in the tools palette of SlopeCharts:
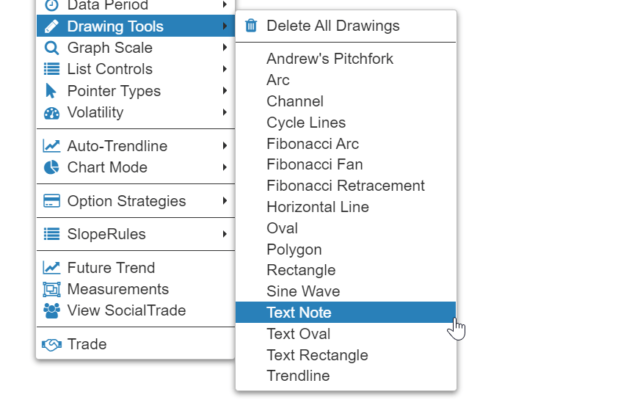
Or, alternately, by right-clicking anywhere inside the chart and choosing the Drawing Tools menu and selecting Text Note:
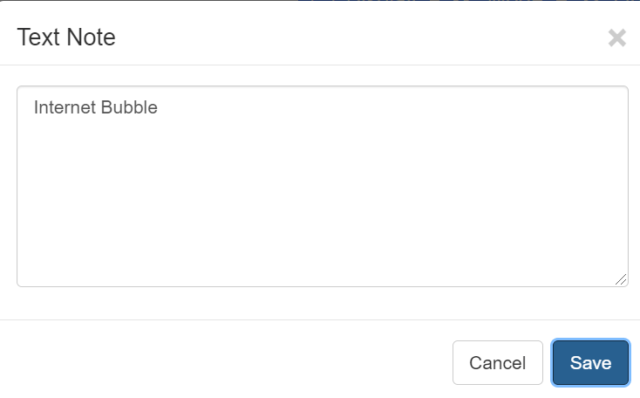
Using this tool is very simple: just click wherever it is on the chart you want to add text, and then type whatever you like inside the Text Note dialog box. It should be mentioned that the text you put on your charts will be searchable, so you can easily find items later based on your text search. Here, for instance, is an extremely brief note which can be preserved by clicking the Save button.
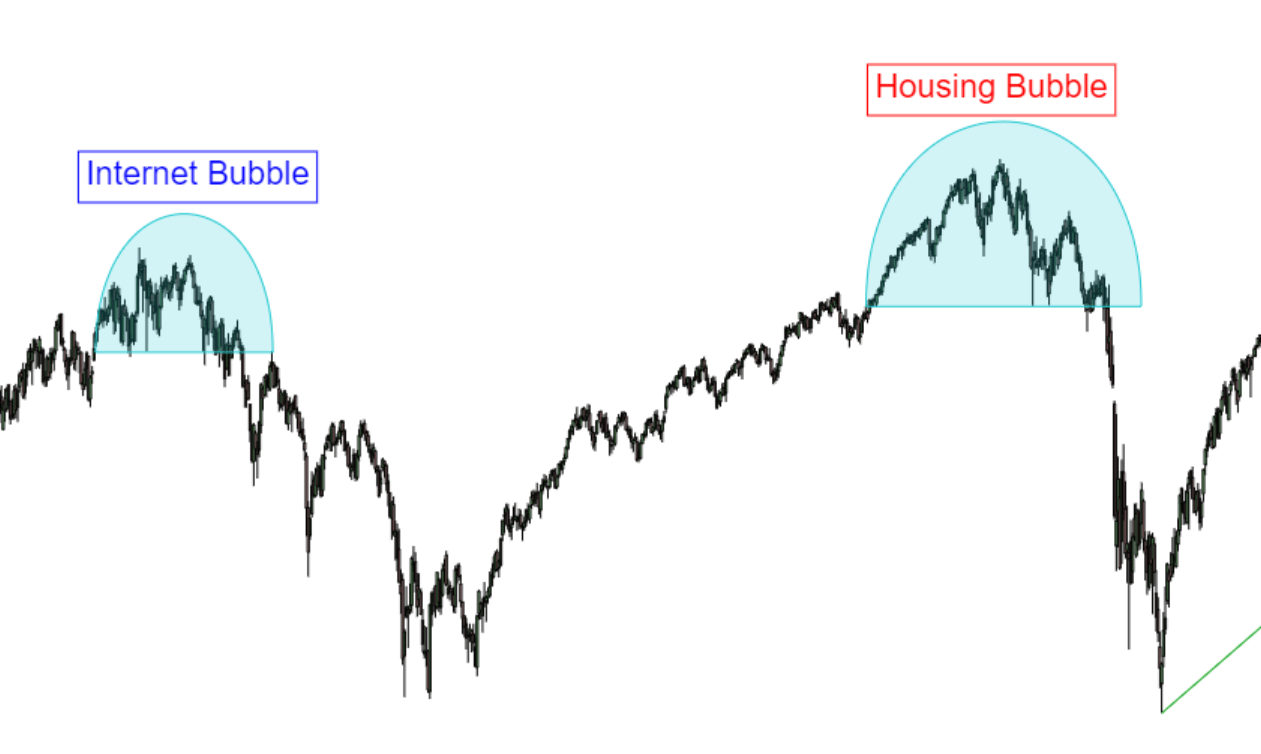
You can place as much text on a chart as you like, and you have almost unlimited flexibility in the appearance of this text, with respect to size, color, whether it is filled, the opacity, and so on.
One very important feature of these text objects is the ability to move them and resize them. As the animation below illustrates, there are two anchor points on any given text object.
One of them allows you to drag the text block wherever you like; the other lets you make the block wider or more narrow. These anchors are distinct and adhere to those specific functions. If for some reason you prefer the “drag anchor” to be elsewhere on the rectangle, you can change the Drag Anchor Location in the customization described below.

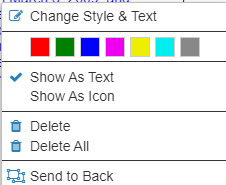
When you right-click on any text object, a sub-menu appears. With this menu, you can instantly change the color of the text, you can choose whether to present the text in its full form or, compactly, as an icon. And you can choose Change Style & Text to reach many custom features.
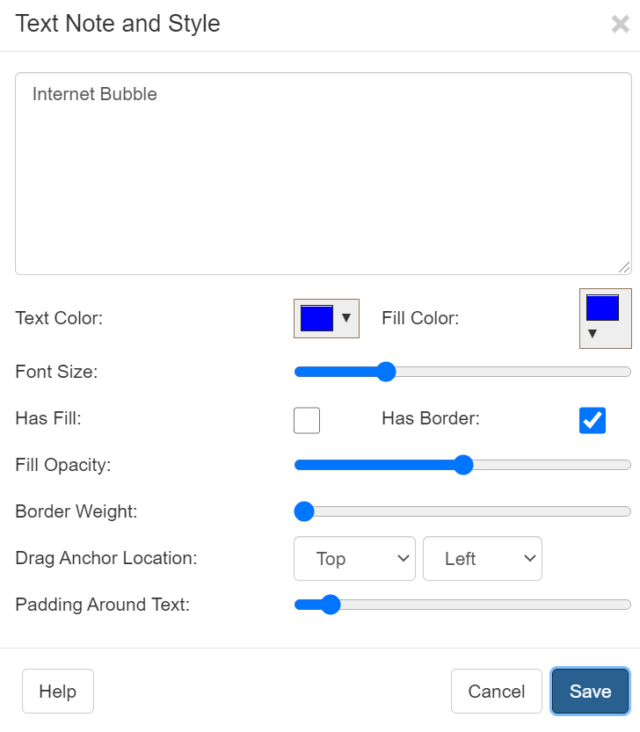
If you decide to alter an existing note, a feature-rich dialog box appears. With this, you can control:
- What text appears;
- What color the text should be;
- What color the “fill” color should be;
- How big the font is, by way of a slider;
- Whether the text box is filled or not;
- Whether the text box has a border;
- What the opacity of the fill is, if any;
- What the weight of the border is, if any;
- The location of the Drag Anchor;
- How much padding should be between the text and the border
Perhaps the most useful feature that the text tool provides is the ability to put a large amount of text on a chart without cluttering it up. This is achieved by choosing Show As Icon. If you use this, instead of text being on your chart, you will instead see a small icon which, if clicked, will reveal the text within. You may click anywhere else on the chart to minimize the text once more.

