A $100,000 virtual trading account awaits you. Click any section title to read more.
Overview
Welcome to Slope’svirtual trading . With this feature, you get a $100,000 trading account (not real dollars, of course) that you may trade any way you wish. There is simply no better way to learn the ins and outs of trading, all without risking a single penny.
The functions for virtual trading are simultaneously located in two places here on the site: one, within SlopeCharts, and two, in the Trade menu. The features and information in those places are identical, so you can use whatever is convenient for you at the time.
There is absolutely no extra charge for using virtual trading. Any paying membership includes access to this service, and it just takes one mouse click to activate your account.
Brokerage Log-In
The first thing you’ll want to do is log in as a virtual trader (you should only have to do this one time). Click on this icon in the lower-left of SlopeCharts (or, alternately, use this web page to log in).
At this point, you will click the Log In button which should……….well………..log you in. You should probably check the “Log In When Accessing Slope” checkbox to ensure that it stays logged in.
Now you are ready to do virtual trading. Click the dollar sign icon in SlopeCharts:
This brings up a dialog box with a series of tabs, each of which has a distinct purpose. You start off with a virtual $100,000 in trading capital, which represents $200,000 in buying power for equities (cash only for options).
Account Balances
You can see your present account overview under the Account tab (whose equivalent web page is here.)
There is a wealth of information here, such as your account equity, how much buying power you have (for either stocks or options), what your position balances are, and so on.
Place Order
For creating and executing trades, there is the Trade tab. (The web page for placing a trade is here). The default trade type is just for equities, so it is quite simple:
But you can also enter complex options trades. The entry fields are all self-explanatory. You can click on the “Add Leg” button for each new option leg you’d like to enter. If you make a mistake, you can click the “X” next to any leg in order to delete it.
There is a button on the equity trading page labeled ETB List. ETB stands for Easy To Borrow and gives you access to a sorted, searchable list of all the equities which are available to sell short. If you click on ETB List, you will see a dialog box with this kind of content:
If you are looking for something in particular, you can type it in the Search field and see what equities are listed as being easy-to-borrow which match your search string.
You don’t need to refer to this list before putting a trade together, however. When you fill out the trade ticket, the system will automatically check to see if the stock is available to borrow and, thus, sell short.
Current Positions
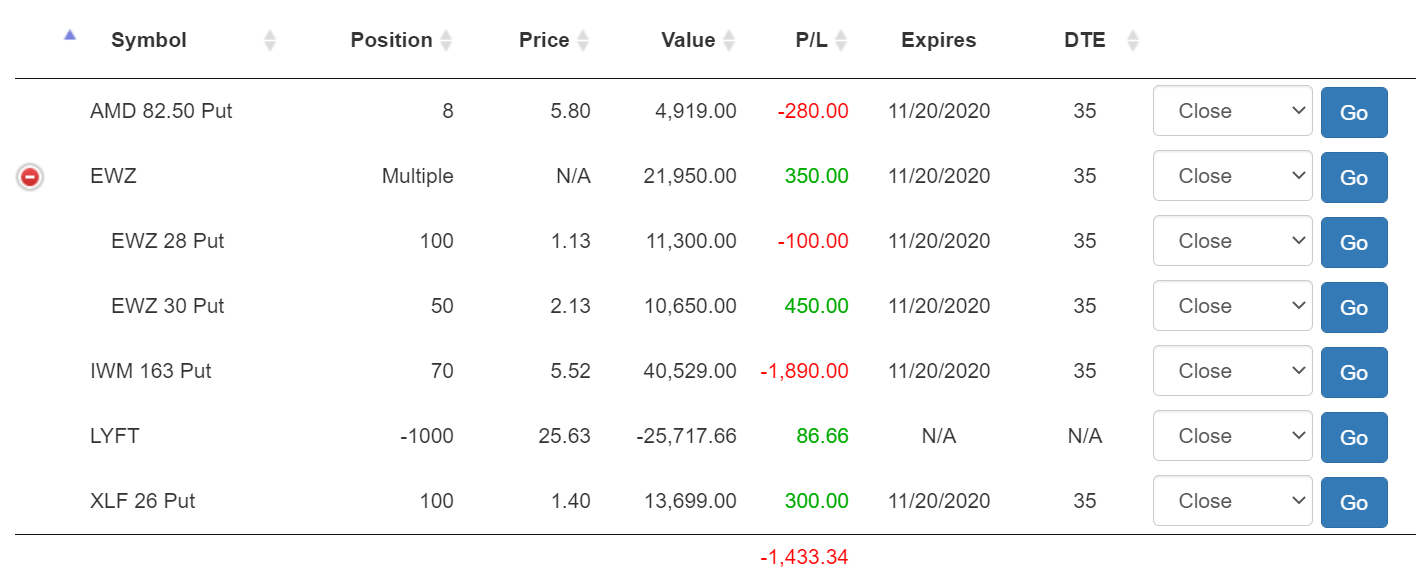
You can see your positions in Positions (whose web page equivalent is here). Short positions are shown as negative quantities, and multi-leg positions have a “+” icon next to the symbol (which, if clicked, expands to show all the legs and changes the icon to “-” as shown below).
Open Orders
For orders you place during the day, you can see both executed and not-yet-executed orders in the Orders tab. When you click on this tab, a single line will appear with a brief description of each order.
If you click on any specific line, the details of that order will be displayed beneath the line. If it is possible to do so, you can also click the Modify or Cancel buttons to either change the order before it executes or cancel it altogether.
Former Positions
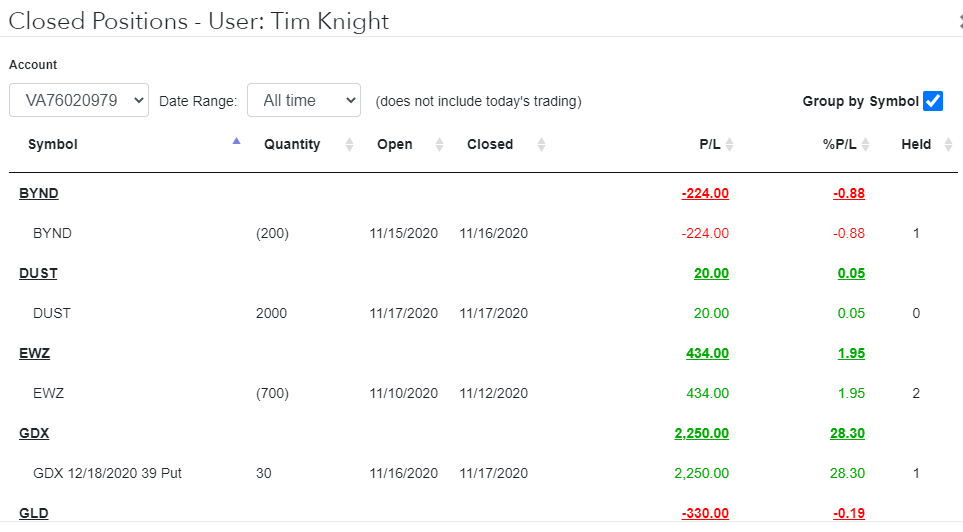
The closed positions, and their respective gains or losses, are in Closed (here is the web page equivalent). You can sort by any of the important columns, you can search based on any number or text, and you can restrict the date range whose results are displayed. You can also use the Group by Symbol checkbox to control whether you want to see all the former positions individually or grouped by symbol. When you group them by symbol, this gives you a quick way to see what financial instruments you do the best (and worst) with, particularly since the sorting will take into account the sum totals of the profits/losses based on the root symbol.
Results
For a summary as to how your virtual trading success is progressing, there is the Results page (web page equivalent is here). This page summarizes your entire trading history and has such information as maximum profit, maximum loss, average hold time, and overall profit/loss.
Strategies
The Strategies tab has links to every informational page about all the strategies, which will provide a handy reference to information on the strategy and a graphic example. More importantly, by clicking on the strategy name, you will create a trade ticket auto-populated with the components of that trade strategy using the current symbol you are charting (if you are doing this within the web page, and not SlopeCharts, it will ask you what ticker symbol you’d like to use). Just click on any general category (such as “Bearish Strategies”) and the specific possibilities for that group will be presented to you. Clicking on the strategy will send you straight over to the Trade tab, ready-to-execute.
Top Ten Traders
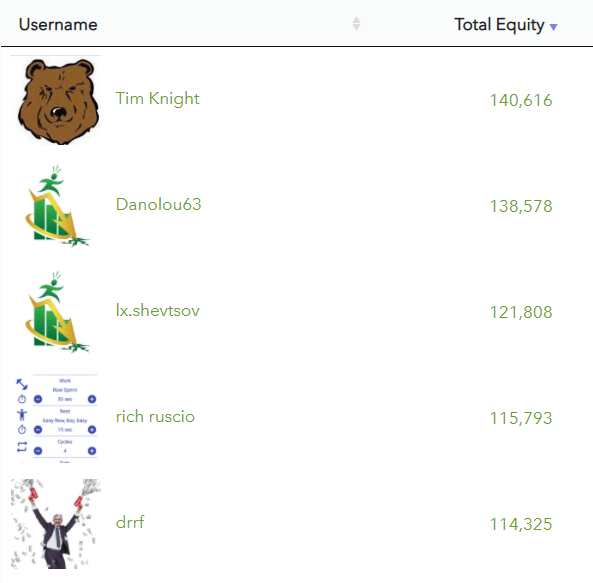
On the Top Ten Traders page, there is a constantly-updated list of the most successful virtual traders, ranked in terms of their Total Equity. You can sort this table of ten based on any of the columns, but the default is Total Equity, which puts the most profitable trader at the top.
The columns available for sorting are Username, Total Equity, Total P/L, Wins, Losses, and Win %. It is possible for a relatively new virtual trader to make the top ten and show absolutely no wins or losses. The reason is because wins and losses are not accrued until the trader is closed. However, a person might have profits already on open positions, and that is taken into account when computing the Total Equity.
If you click on a username, a new tab will appear with the profile of that particular Sloper. You can click other items, however, to drill deeper into what made these virtual traders so successful.
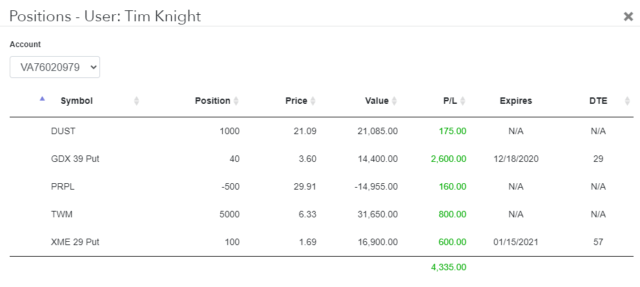
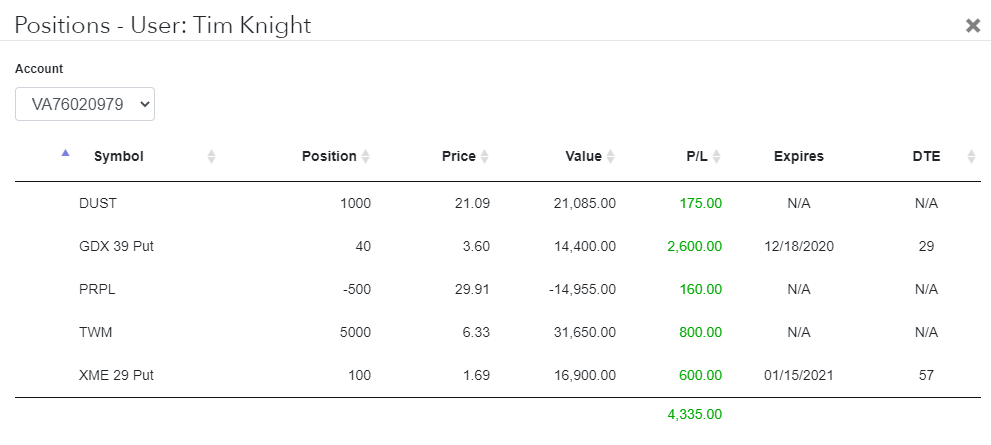
If you click on Total Equity, for example, a window will appear showing that person’s current positions and the P & L for each one. You can sort any of the columns in this window.
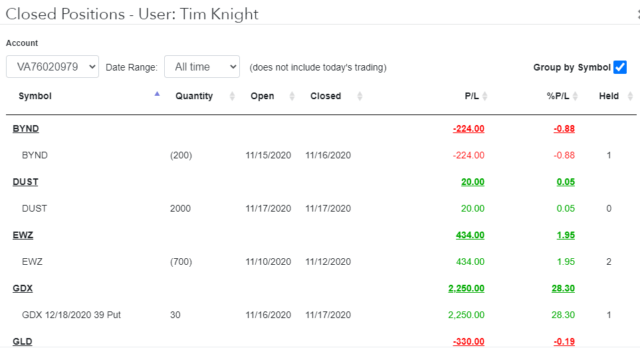
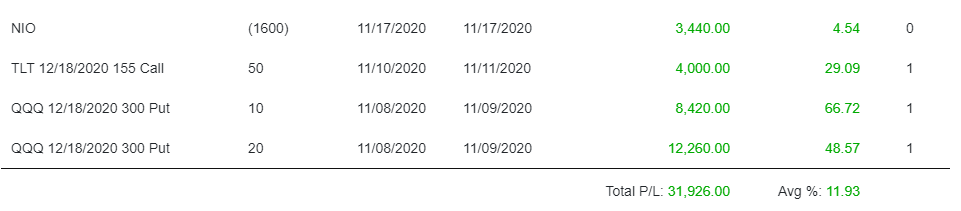
By clicking on any specific Total P/L, you can see that user’s closed positions. What’s especially powerful about this is that you can see all the positions individually (by checking Group by Symbol) or as the sum total of all profits and losses for each symbol. This provides a very swift way to see where the concentration of any person’s profits and losses were.
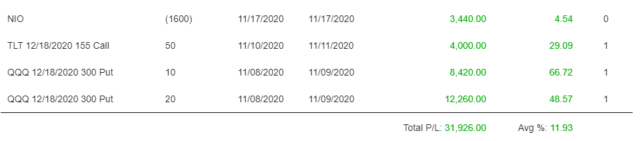
And, by scrolling to the bottom of the Closed Positions window, you can see the grand total of profits (or losses) in dollar and percentage terms.
By digging into the details of the Top Ten Traders, you get an endlessly interesting and constantly changing view into the goings-on with the top virtual traders on Slope.
 There is absolutely no extra charge for using virtual trading. Any paying membership includes access to this service, and it just takes one mouse click to activate your account.