The horizontal line is the simplest drawn object of all, since it requires only one anchor point. As the name suggests, it places a horizontal line on your chart, and it is most typically use to create a boundary showing a support or resistance level.
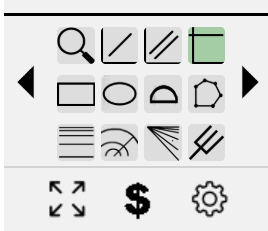
To use it, click on the Horizontal Line icon:
Move the cursor to wherever you want to place it and click the mouse.
You can right-click on the line to change its color, whether or not it extends in either direction, as well as alter other properties.
If you’d like to put text on the line to explain what it represents, right-click on the line and choose Change Style.

There is an entry box called Line Text where you can type in whatever you like. You can also change whether the text is above or below the line, if it is right-, center-, or left-aligned, and what the font size should be.

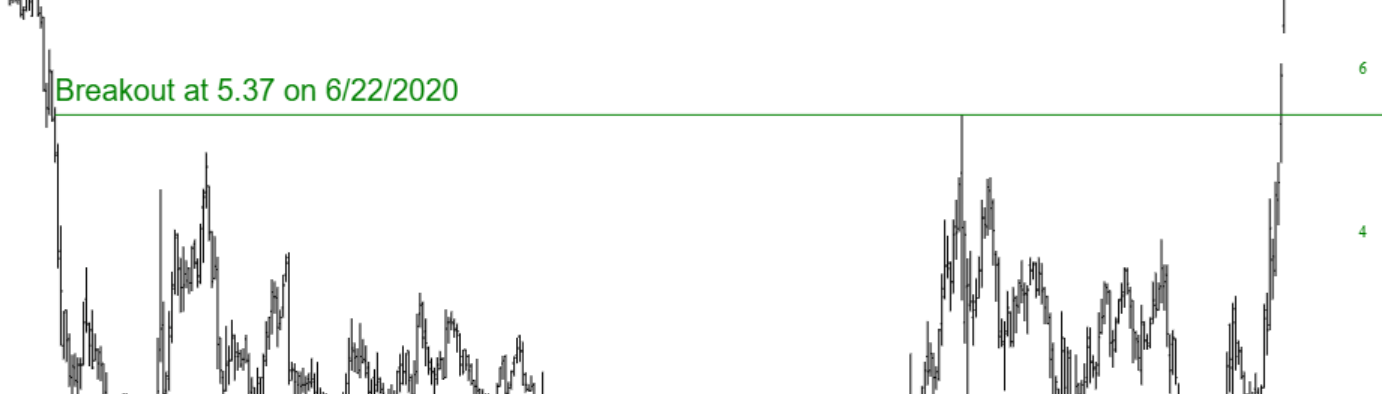
If you enter text, it will appear adjacent to the line with whatever color, alignment, and style you selected. If you save the settings as a default style, then the text parameters will be preserved just like the color, opacity, and other properties.
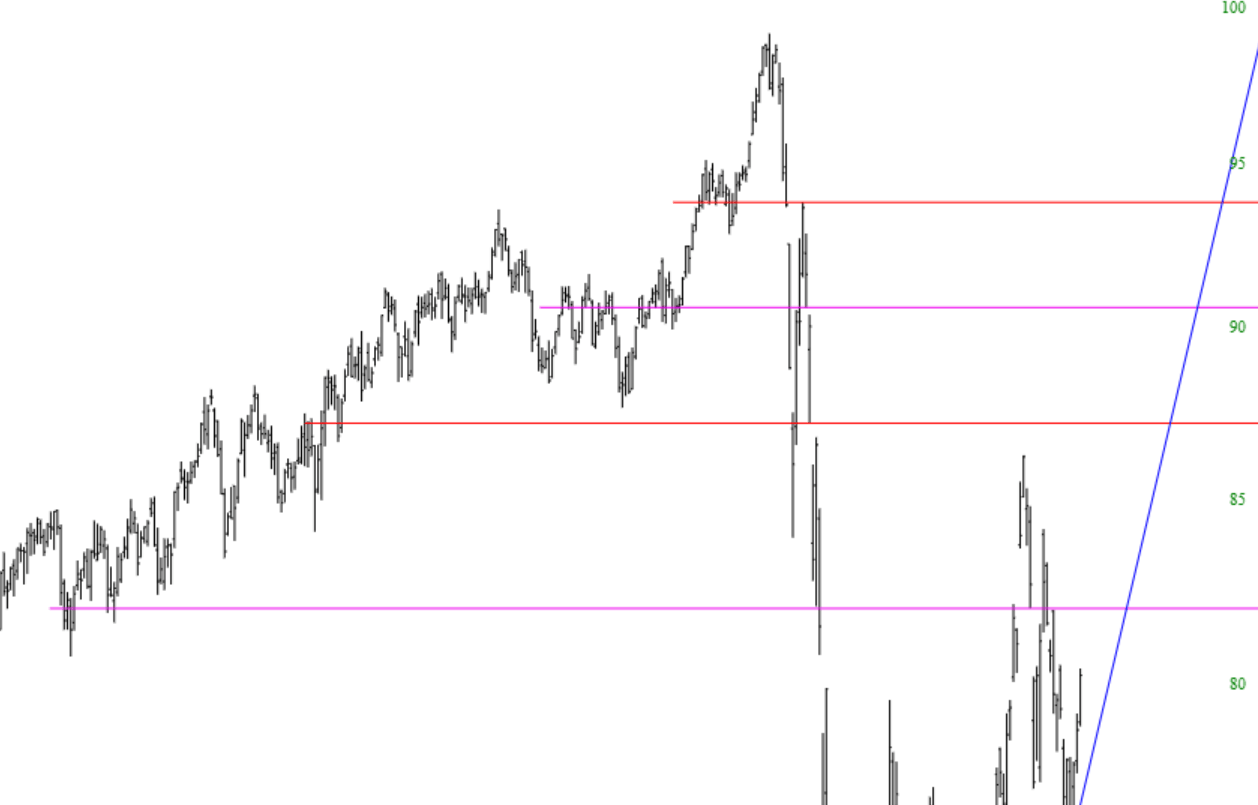
Here are some examples of the horizontal lines on price charts, illustrating their purpose showing zones of support and resistance.