The purpose of the tool is to create a “payoff” chart so that, for a given options spread trade, you can assess its maximum loss, maximum profit, and break-even point. This feature is for Gold and Platinum members (membership information is available here).
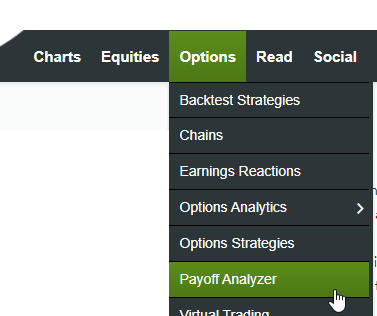
You can access the Payoff Analyzer by clicking here or choosing it from the Options menu:
The input area offers you a variety of fields to define the options spread you would like to examine:
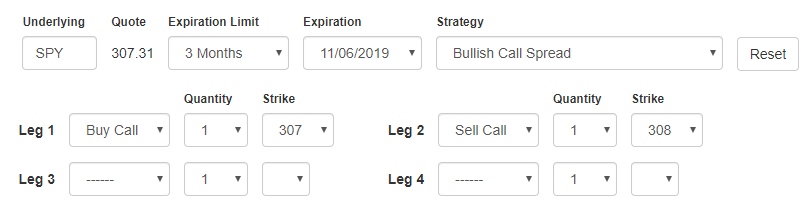
- The underlying symbol; the default is SPY, but you can enter any optionable symbol you want;
- Once you enter a symbol and press Enter or Tab, the most recent quote will appear and the expiration dates available for that symbol will be presented in a dropdown menu;
- You can restrict how lengthy this Expiration dropdown menu is by choosing the Expiration Limit, which controls how far in the future dates should be included;
- Select whatever expiration date you would like for your strategy;
- You can then enter anywhere from one to four “legs” of a strategy. Each of the legs lets you choose any of four actions, a quantity, and a strike price. The four possible actions on each leg are Buy Call, Sell Call, Buy Put, and Sell Put.
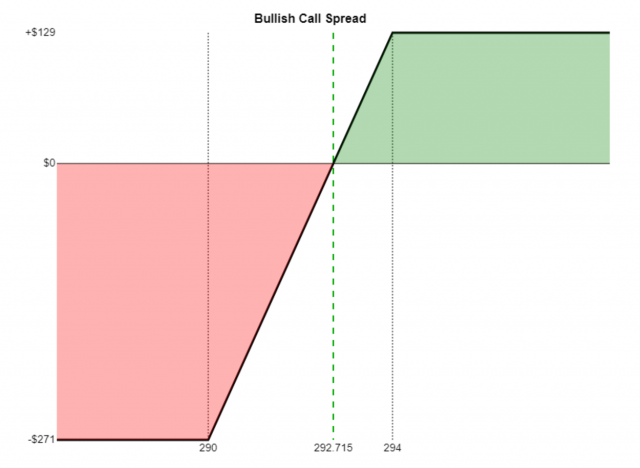
Once you finish entering the legs of the strategy, the payoff graph will be presented along with the name of the strategy you have defined. Some example are the Bullish Call Spread:
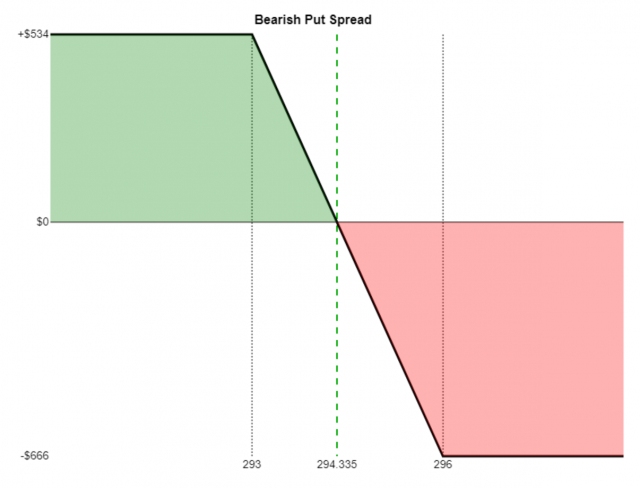
The Bearish Put Spread:
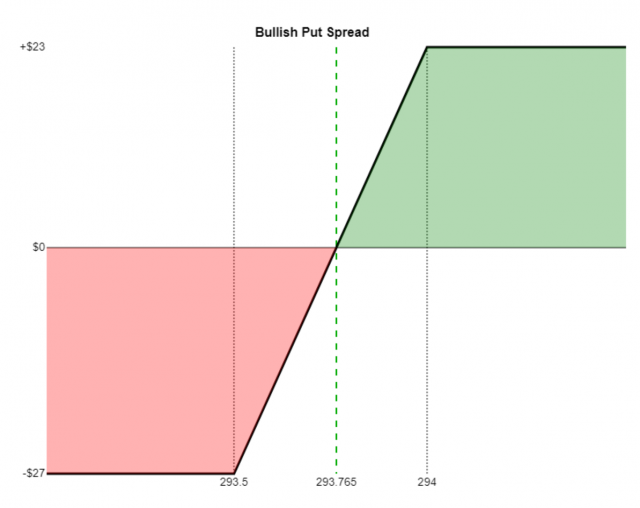
The Bullish Put Spread:
And, lastly, the Bearish Call Spread:
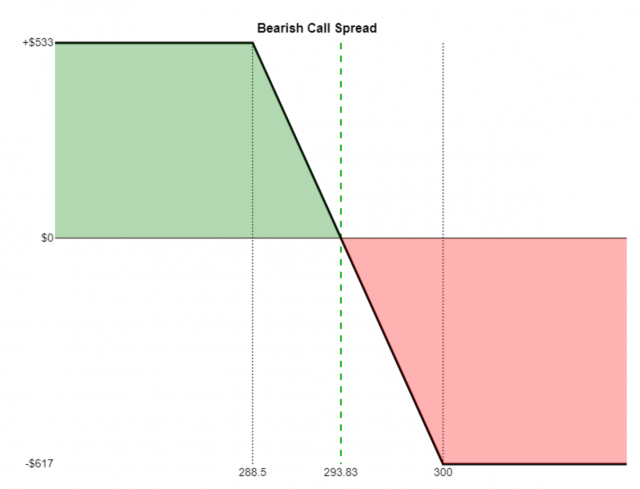
Each graph provides useful information:
- A visual representation of the profit zone (green) and loss zone (red);
- Two vertical lines, representing the strike prices for each leg;
- A dashed line showing the break-even value for the underlying on expiration day;
- In the upper left, the value of the maximum possible profit (not including commissions);
- In the lower left, the value of the maximum possible loss. Both the profit and loss will take into account the quantity you have chosen.
To be clear, this graph does not take into account time premium, time delay, or any of the other “Greek” calculations. It is a deliberately simplistic way of viewing opportunity strictly through the lens of the ultimate payoff (or loss, as the case may be) by the time the option legs reach their expiration point.
You can learn more about the various options strategies by clicking here.
One other approach you can take is to use the Strategy Dropdown, which offers you “ready made” legs and strike configurations. The menu resembles this when clicked:
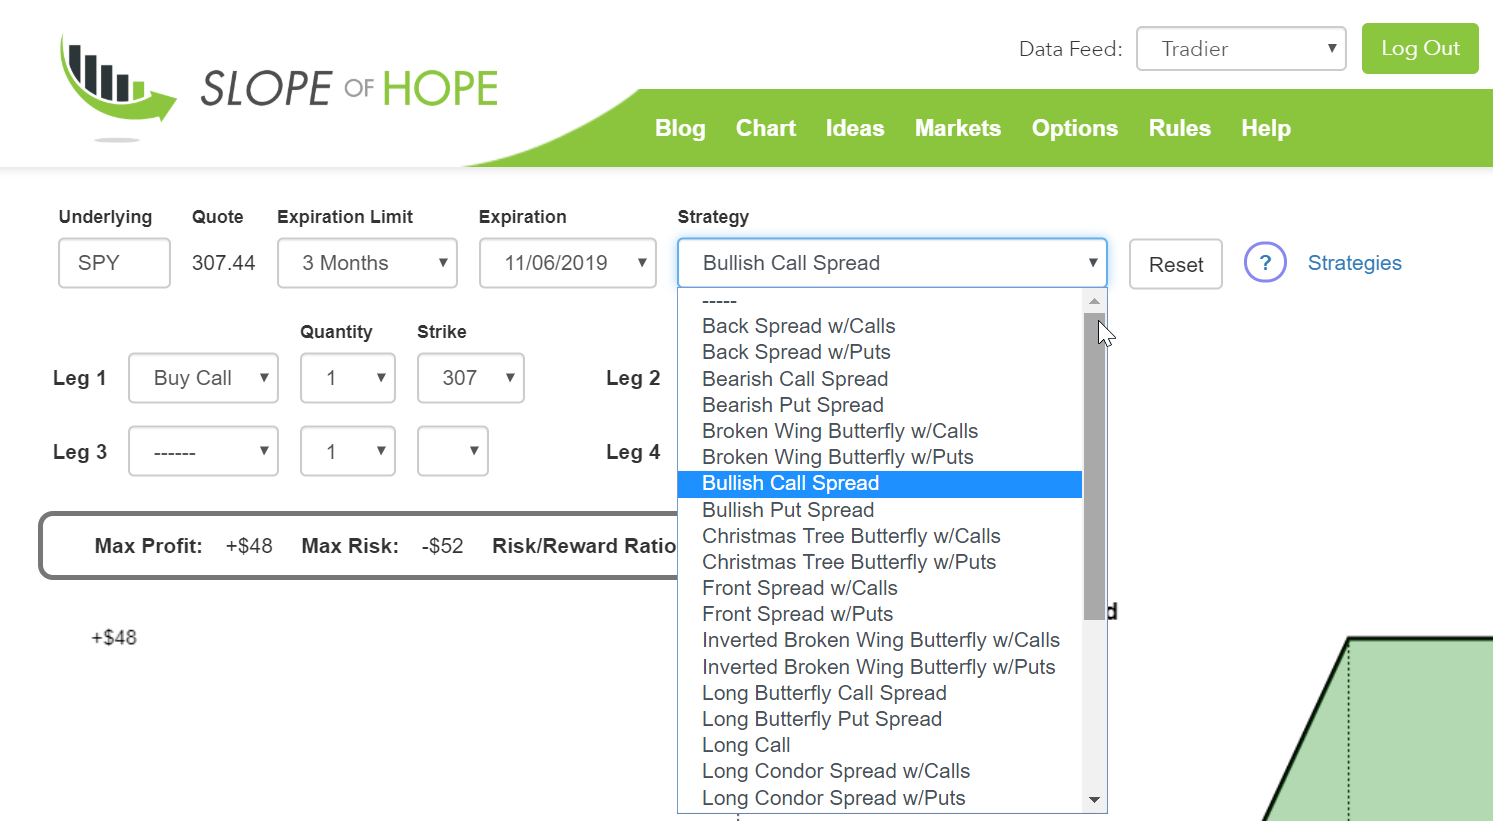
You can choose any strategy, and an appropriate setup will be displayed. Of course, you should choose the expiration and strikes you consider appropriate after the default values are presented, but it will at least get the basics set up and likely save you quite a bit of time. Click on this link to see an example of how various strategies are presented as you scroll through different items of the dropdown menu.
