Future Trend is a rather unique feature in SlopeCharts which shows the next projected two years of price data. This feature is available only to Platinum users. You can upgrade your membership to get immediate access by clicking here. You can watch a video about this feature here.
Now, of course, this price projection does not represent the actual price data that is going to take place over the next two years. However, what we have done is created our own proprietary system which uses historical price data and seasonal trends to project an idealized and hypothetical path forward for a given security.
Accessing this feature is a cinch; just choose it from the Tools menu:
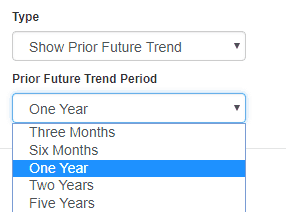
You are then presented with a dialog box resembling the following:
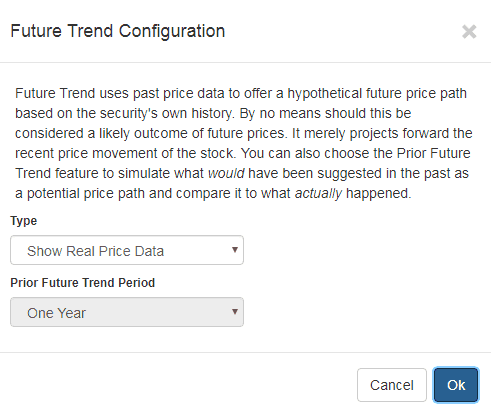
The “Type” dropdown gives you three choices:
- Show Real Price Data – a normal price chart, like you usually see.
- Show Future Trend – projects two years into the future (hypothetical path).
- Show Prior Future Trend – shows what the Future Trend would have been in the past.
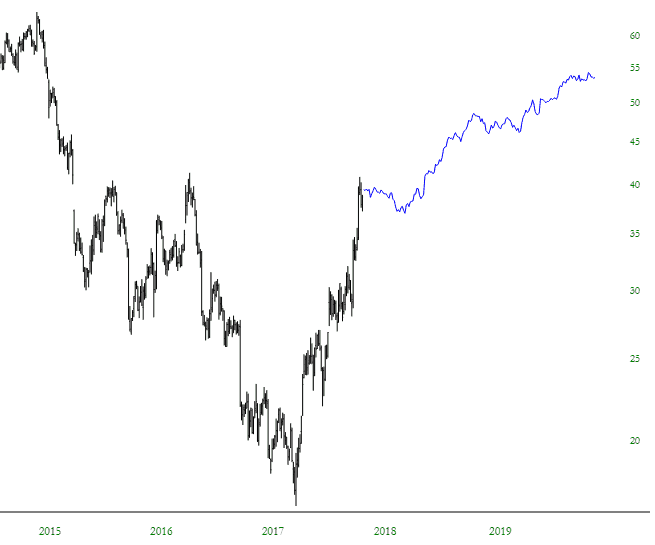
Show Future Trend will plot out the next two years of presumed price data. Again, to be very clear, it doesn’t predict the future. When it is activated, any chart you see with a sufficient amount of prior price data will display a blue line chart two years into the future.
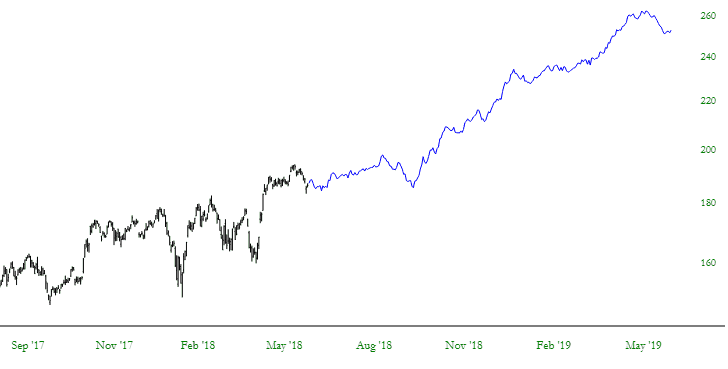
Here’s another example.
And USO, just to show that not every chart goes up:
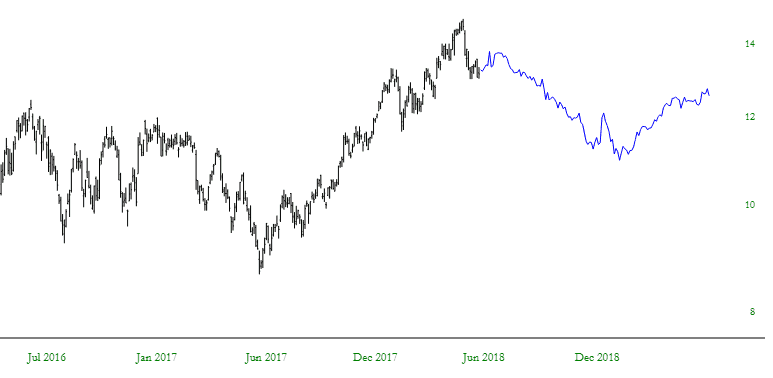
You can zoom in on the future, and the data line shows the information, and it’s generally-speaking the same spiffy SlopeCharts experience that you’ve come to expect from the finest browser-based stock chart platform that exists.
An even more interesting aspect is to “dial back” time and see what would have been predicted in the past and compare it to what actually happened. Choosing Show Prior Future Trend allows you to use the second dropdown to choose how far back in time you want to test.
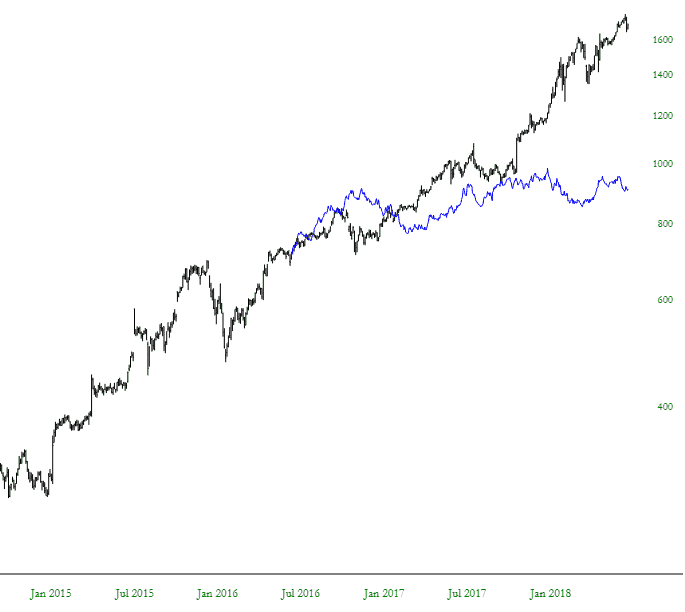
Here is Amazon, for example. As you can see, AMZN drastically beat its “forecast.”
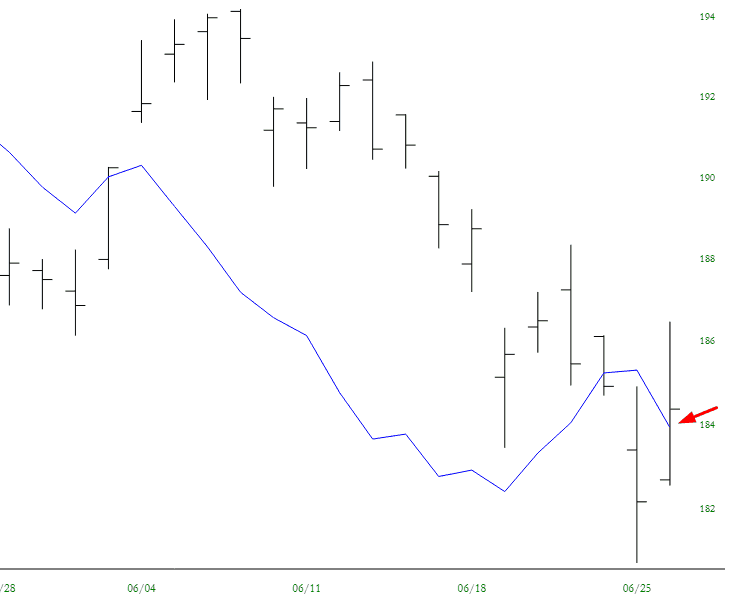
Apple, on the other hand, is almost jaw-dropping in its accuracy. The real price and the projected price didn’t stay anywhere close to one another, but broadly speaking, the projection was amazingly prescient.

Indeed, looking closely, as of this writing, the projection from two years prior was accurate almost to the PENNY.
Some charts will prove themselves to be more “predictable” than others, and it’s enjoyable to experiment with different securities to see how “trend-friendly” they are. Beyond this, observing how both trend and seasonality play out (such as below, with the SPY) can be a fascinating examination.

