A gap in the price of a security takes place when there is a large amount of empty vertical space between price bars, representing a sudden (and usually unexpected) rise or fall in price. Many things can cause a price gap, such as surprisingly good earnings, surprisingly bad earnings, FDA approval (or disapproval) of an important drug at a pharmaceutical company, a takeover of a company, and so on. Usually, something has taken place between market sessions that compels much more buying and selling pressure than would be experienced by the same stock on an ordinary day.
This is one reason that, while stop-loss prices are very helpful, they are not a guarantee of safety. If you are long a stock you bought at $10, and you have a stop-loss at $9.99, you are not assured that, no matter what happens, any loss you experience will be miniscule. The company might announce that it has been fabricating its accounting for the past five years, and it opens the next day at a bid of $2, which is the price you’ll probably get (if you’re lucky). Such a shock-event would be a gap.
Definition of the Pattern
The simplest definition of a gap is a positive difference in price between one days’ maximum value and the next day’s minivalue value (or vice versa). If Monday’s highest price is $15 and Tuesday’s low price is $16, that would be a gap. If Thursday’s lowest price was $14 and Friday’s highest price was $13.75, that would also be a gap (albeit a small one).
The gaps which concern are usually are usually more dramatic than twenty-five cents; they are usually very easy to spot in a chart, and plenty of free scanning services on the Internet will provide you a list of the day’s up-gaps and down-gaps so far. If you have read about gaps, you have probably encountered various terms for different flavors, such as exhaustion gaps, common gaps, runaway gaps, and so forth. In my experience, these assignations aren’t valuable, and we shall content ourselves to focus on meaningful price gaps and how we may exploit them.
Figure GP-1 shows the company Equifax ,which gapped higher on April 25, 2003 on strong volume. You will often see a substantial increase in volume on gap days because of the buying excitement (on up-gaps) or stop-loss orders being executed in large numbers (on down-gaps). The stock continued higher, buoyed by the excitement of the gap-up, then – – as is often the case – – it started selling off. It closed the gap, which is precisely the kind of action we want to see as a buy-signal, and then began a more sustained ascent, nearly doubling in price before its next meaningful correction.
The theme described here – (1) a gap; (2) a push in the gap’s direction; (3) a retracement; (4) a more powerful move in the original direction is one you’re going to see repeatedly in this section. Our job as traders is to spot these gaps and enter these positions at the safest time. In addition, you will want to look for gaps that break out in the same general direction as the stock. The up-gaps you are going to see in this section are for stocks that are already climbing, and the down-gaps you are going to see are for stocks that are already falling.
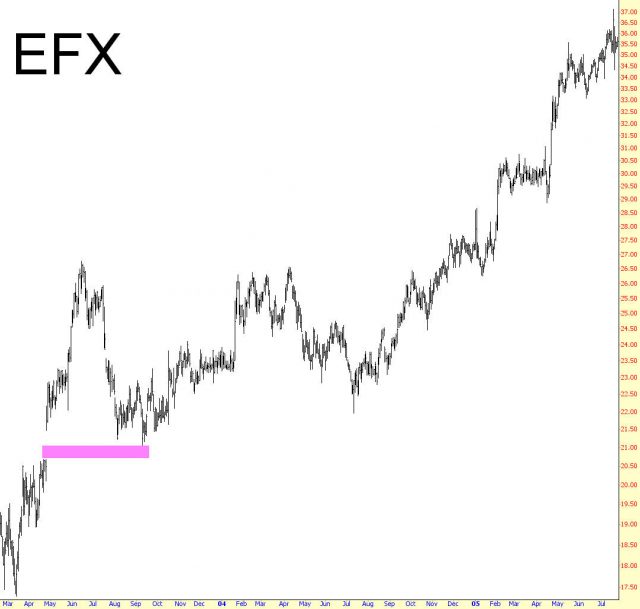
(FIGURE GP-1: Although the chart doesn’t show the the continued climb, this stock nearly doubled in price before enduring any meaningful correction after the gap took place.)
Psychology Behind the Pattern
Let’s consider a hypothetical stock which has been steadily climbing in price from $10 to $20 over a period of a few years. It’s a decent performer, and the shareholders are generally happy with the gently-rising value of their holdings.
On a given Tuesday, after the close, the company announces surprisingly good earnings. The company’s new product line is selling better than expected, and their margins have improved substantially . The analysts following the company up their recommendations from “Buy” to “Strong Buy”, and even though the stock closed at $20 during the regular trading session, it’s already evident from the after-market quotes that there is a lot of buying interest in the stock, thanks to all the good news.
On Wednesday morning, the stock opens at $22, 10% higher than its close, and the stock appears automatically on various “Top Gainers” lists, “Hot Stocks” lists, and so on. The front pages of finance-oriented web sites mention the good day the stock is having, and more buyers pile in.
Over the coming three weeks, more analysts start following the company, offering glowing reviews of the firm’s prospects, and the stock pushes up to $25, a 25% gain in just a few weeks. Now the price starts cooling off as owners of the stock decide that a 25% gain in a few weeks is plenty, and they would rather take money off the table rather than put their gains at risk. Those who are long the stock, both old-timers and newcomers, watch somewhat uncomfortably as the price ticks down to $24.50, $24, $23.50, and lower. Selling increases as stop-loss orders get hit, weak hands decide to click the Sell button, and those who jumped into the security at $25 are regretting their decision and decide to take their loss now rather than risk worse losses.
The stock is now getting close to the $20 price it was at before the good news was even announced. Those newcomers who bought between $22 and $25 have either dumped their position or have decided to wait it out. Long-term holders who bought between $10 and $20 are content to stay put, since they are still looking at a profitable position and the company’s positive prospects haven’t changed. Selling dries up, and slowly the buyers begin to get the upper hand on sellers once more. After all, the stock is now at about $20, which was its value before all the positive announcements from the company were factored in, so some people recognize a terrific bargain since they are able to get the stock without paying the premium that the gap demanded.
So the stock starts rising again, and the reality is that the company’s fortunes have indeed improved, irrespective of the stock price’s machinations. The products they sell are popular, the margins are good, and the earnings are going to continue to improve. Now that the excitement – and brief disillusionment – with the stock price – are over, more normalized buying and selling return, and overall there is much buying interest than selling interest, pushing the stock far behind its prior peak of $25.
This scenario is, in broad terms, what happens with a gap-up, and the converse can be applied to gaps-down in price. There is excitement (or fear); a strong push up (or down); a retracement back toward the gap; and then finally a more sustained continuation in the direction that the gap established in the first place. This is why you can take advantage of long or short positions with gap-fills. Of course, a stock doesn’t necessarily have to fill its gap, but when it does, it represents a lower-risk opportunity to enter into a position since the market has “tipped its hand” with respect to the security’s likely next move.
Example: CBS Corporation
The chart is CBS, Figure GP-2, makes the decision for a trader easier, because the gap fill also coincidentally marks the completion of an extremely clean inverted head and shoulders pattern. The gap was filled a mere ten days later, which also, by definition, was the retracement to the neckline.
It must be pointed out that a “gap fill” doesn’t necessarily mean that the stock price will go back, to the penny, to where the gap took place. Indeed, the price may gap up (or down) and never look back. In those instances where the price is retracing, the closer the price gets back to the original gap, the lower the risk is. If a trader waits until the gap is totally closed, however, he may never get an opportunity to enter the position. In this case, the lower price of the gap was at $8.97, and the lowest price CBS sank to afterwards was $9.40, still about 5% above the gap. There is no pre-defined rule that states when a trader is safe to enter, but a good balance is to “leg in” to a position during the retracement.
In other words, if a person intends to take on a $10,000 position, he might buy $2,500 at one price, and the stock might sink a bit further, then buy another $2,500, and perhaps the stock sinks further still, another $2,500, and then suddenly the stock rockets higher, suggesting that the retracement is over, at which point he buys the final $2,500. Because he cannot know how low the price will go, he spreads his risk. The price will, by definition, be somewhat higher than the lowest possible price, but it is simply not realistic to expect to pay the best possible price for a position. At least by legging in one does not sit idly by as the stock quietly makes a bottom, rockets higher, and then makes the risk/reward much less attractive.
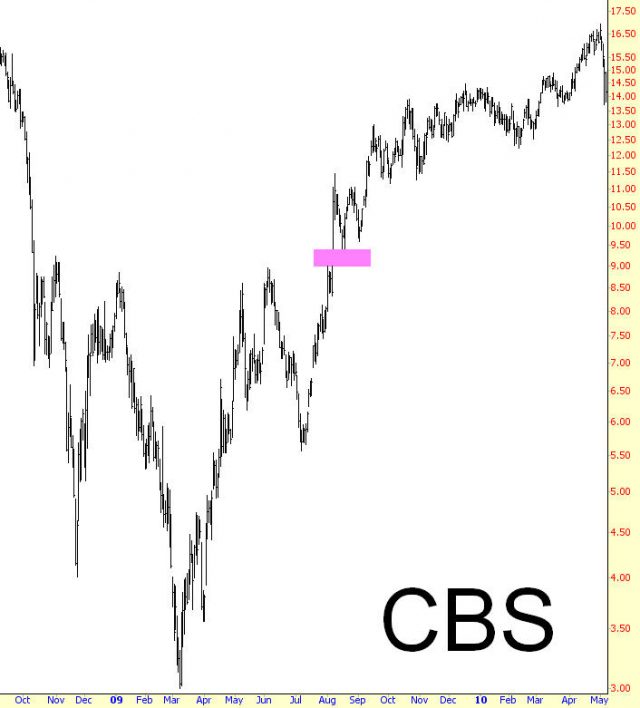
(FIGURE GP-2: We can see here that the gap also represented the completion of an inverted head and shoulders pattern)
Gap Date: 8/7/2009
Retrace Date: 8/17/2009
Gap Price: $9.40
Post-Gap Price: $16.87
Percentage Change: 79%
Example: Atheros Communication
If a stock retraces back close to its gap, that is a relatively low-risk entry point, but the stock might revisit that gap in the near future. The key to holding on to such a position is to set the stop-loss price at a logical level. Some people choose a price just beneath the gap, although this opens up the risk that the price will move a few pennies beneath the gap before reversing, taking you out of an otherwise good position. If you want to be very conservative in your gap trading, you might want to set your stop-loss just a small amount – perhaps half a percentage point – beneath the gap.
Figure GP-3 offers an illustration of a stock which revisited its gap once soon after, and then a second time some months later. Important, the second visitation did not violate the gap, and indeed its low price was a little higher than the first retracement. This was the kind of “higher low” that is constructive to positive movement in a stock’s price.
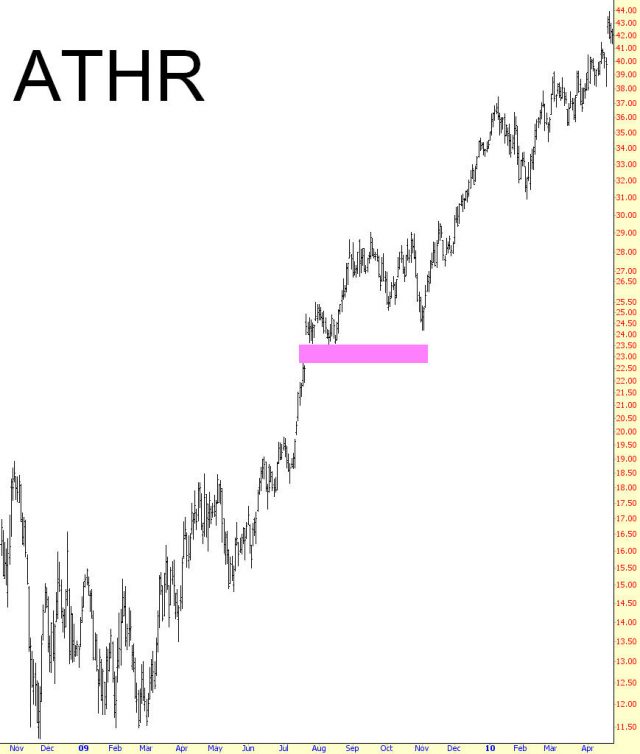
(FIGURE GP-3: This gap was partly retraced twice, but the window remained open)
Gap Date: 7/22/2009
Retrace Date: 11/3/2009
Gap Price: $24.18
Post-Gap Price: $43.90
Percentage Change: 82%
Example: Darden Restaurants
After a gap, a retracement may or may not take place, and if it does take place, it may happen quickly or it may take an uncomfortably long time for it to complete. This is another reason why patience – and legging in to a position – can make waiting for a full retracement more bearable.
A fitting example, which also is illustrative of the risk of jumping in to a hot stock after it has initial taken off, is shown in GP-4. Darden Restaurants leaped higher on March 18 and it peaked soon thereafter on April 22. It then meandered slowly downward to a loss of about 25% by November 2nd. You can imagine how exasperated buyers of this ostensibly hot stock were to see their equity value wither away.
More prudent observers could use the gap as their guide, using a price of about $28.50 as their “magnet” to leg in to a position. The point is that a retracement can take a while, and patience can be profitable.
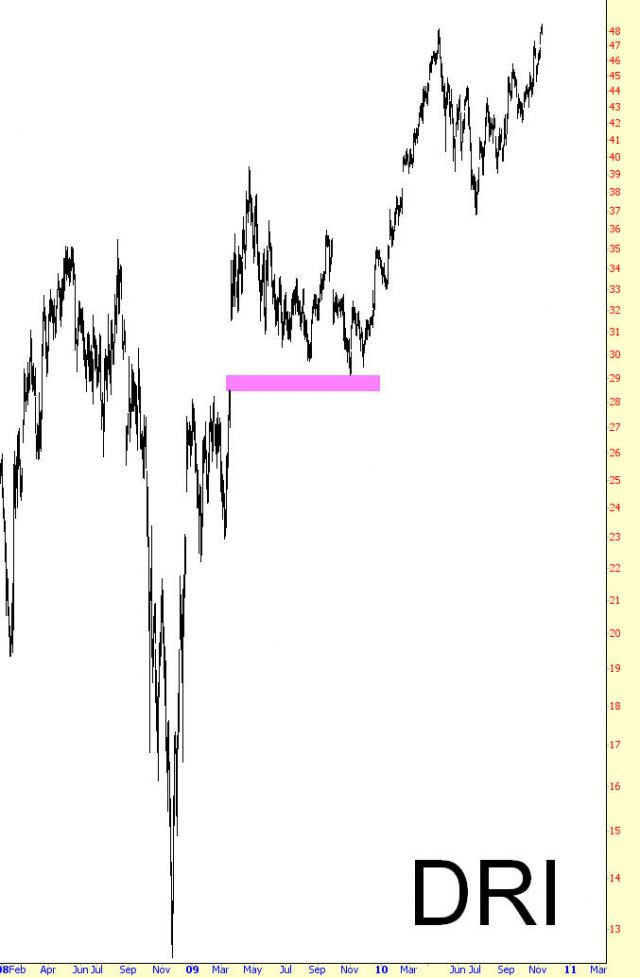
(FIGURE GP-4: Those who bought after the gap had to endure a nearly 25% drop in price before the real move higher got underway)
Gap Date: 3/18/2009
Retrace Date: 11/2/2009
Gap Price: $28.89
Post-Gap Price: $47.91
Percentage Change: 66%
Example: Holly Corp.
It is axiomatic that a stock which enjoys a large increase in price experiences a series of higher highs and higher lows. No stock goes straight up, but a stock that is in a broad uptrend will take its occasional downturns in stride, and the selling pressure from these instances won’t be so strong as to push the price lower than its most recent important low.
Figure GP-5 provides an example of the kind of stock position that can be life-changing for large holders, since HOC went up by a quadruple-digit percentage. Preceding this amazing lift was an important gap on March 31, 2003. The volume that day was also a strong signal, since there were 5,316,800 shares traded versus only 120,800 the day before. Almost the entire gain the stock was going to see that year was experience on that one day, and it fell from then on for almost the entire balance of the year.
Importantly, the retracement didn’t sink beneath the gap, and an entry late in the year would have offered a superb price for a stock that had already demonstrated its ability to much much higher.
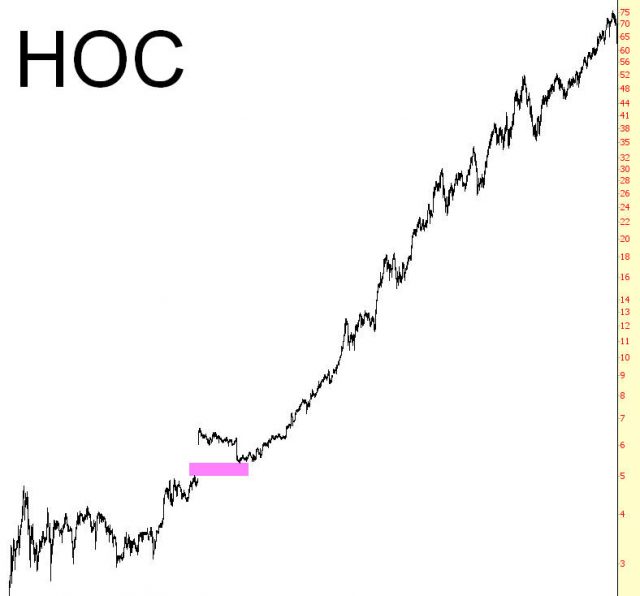
(FIGURE GP-5: This astonishingly steady rise in Holly’s price was signaled by a very strong up-gap and a retracement that offered a superb buying opportunity)
Gap Date: 3/31/2003
Retrace Date: 9/2/2003
Gap Price: $5.37
Post-Gap Price: $12.52
Percentage Change: 133%
Example: Krispy Kreme Doughnuts
We now turn our attention to some example of stocks which gapped down in price during their own broad downtrends.
As a public company, Krispy Kreme has had an interesting history. It came public in the midst of a brutal bear market, but it was one of the very few stocks that actually went up during 2001. Indeed, on the week after the 9/11 terror attacks on America, Krispy Kreme actually closed higher for the week, which surely made it a rarity.
The stock made its ultimate peak on August 13, 2003 at nearly $50 and began to slide downward. By the gap the gap in GP-6 took place, the stock had already lost nearly 90% of its peak value.
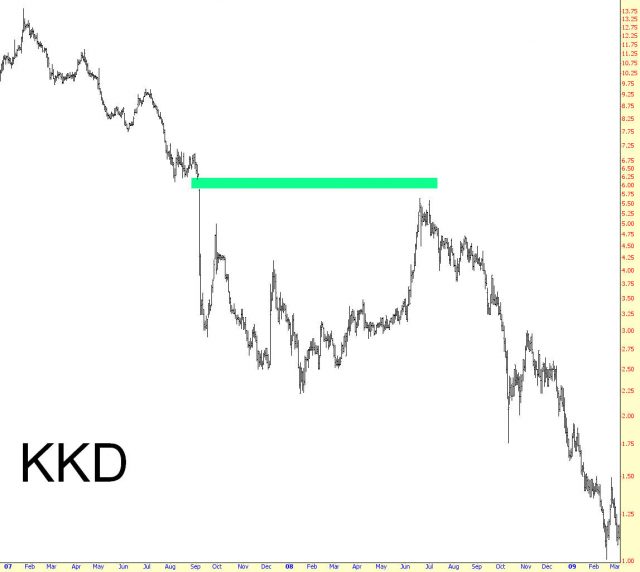
(FIGURE GP-6: The sudden drop from Krispy Kreme was followed by months of weakness, but nearly a year later, the gap was filled better than their jelly doughnuts)
Gap Date: 9/7/2007
Retrace Date: 6/19/2008
Gap Price: $5.65
Post-Gap Price: $1.01
Percentage Change: -82%
Example: Dish Network
Now we see in GP-7 a sudden drop in the Dish Network’s stock on January 2, 2008. For those selling a stock short, it is especially important to time your short well, because you may have the aded burden of dividends. In other words, if you buy into a long position too soon and have to wait a year for things to turn higher, you at least will receive dividends while you wait (assuming the stock pays dividends). With a short position, the opposite is true; you not only have the uncomfortable uncertainty of dealing with a stock that may be moving higher, but you’ve got to pay dividends for the privilege (and, in many cases, interest for borrowing the stock in the first place). So minimizing your waiting period on short sales is key.
By May 20, 2008, the stock was back up to 32.85, only forty-five cents beneath the gap. The stock had already visited $23.40 during its dip, so obviously waiting for the closure of the gap would have been very beneficial for a person waiting to enter a short position (or, alternately, would have offered a very good opportunity for an unhappy bull to get out of their long position). From that point, the stock fell hard, getting as low as $7.59 before finally turning around.
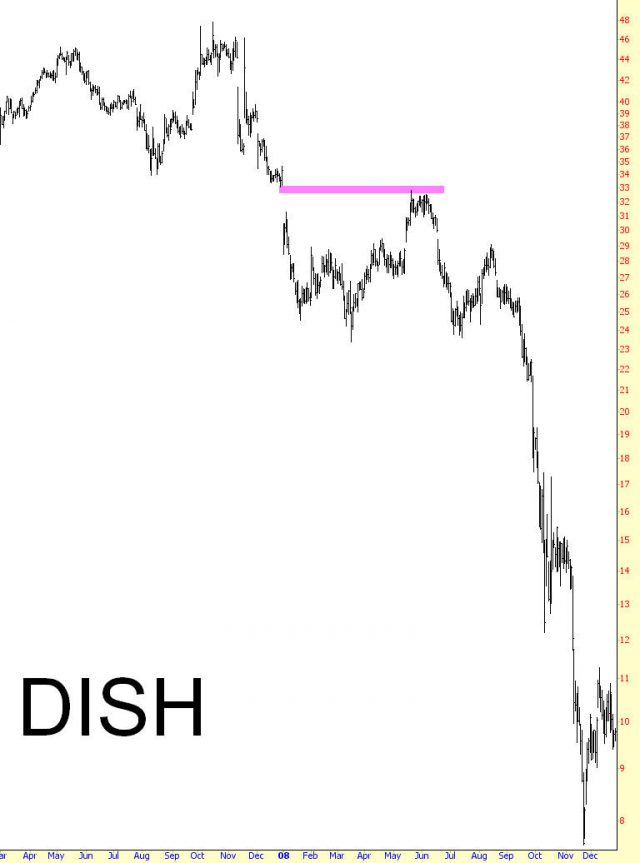
(FIGURE GP-7: When this stock got back to about $33, it represented an ideal opportunity for a short-sale)
Gap Date: 1/2/2008
Retrace Date: 5/20/2008
Gap Price: $32.85
Post-Gap Price: $7.59
Percentage Change: -77%
Example: Agilent
The electronics firm Agilent came public on November 22, 1999, and although it had a nice run higher initially, the bear market of 2000-2002 took its toll and sent the stock heading down beginning on March 7, 2000. As part of this downtrend, the stock gapped down on July 21st on volume more than ten times greater than the prior day.
The stock provided two opportunities for bears to get in at good prices; the first was not long after the gap, on August 29, and the next was on January 18 the following year. In each of these cases, the price approached – but did not exceed – the top of the gap. A person entering a short position on August 29 could be forgiven for entering somewhat too soon, since the price was still excellent.
The retracement on January 18 was a bit higher than the prior one, and afterward the price plunged 85%. It is evident with examples like this what a powerful risk/reward ratio can be found with short positions based on gaps. A person entering a short at, for instance, $63 with a stop-loss at $72 would be risking about 14% on the trade, but in light of the 85% profit that was enjoyed, it was well worth the risk.
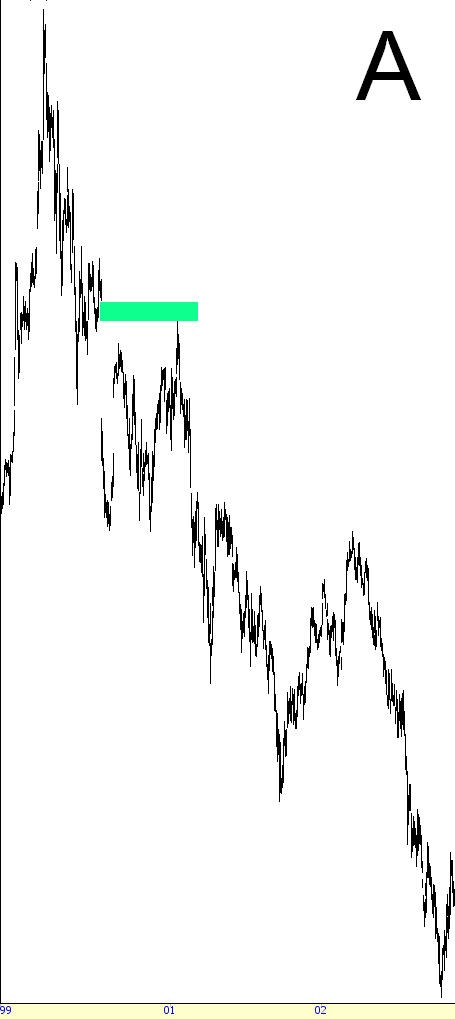
(FIGURE GP-8: This is an outstanding gap-fill in which an earlier attempt to fill the gap failed but was bested somewhat later by a heartier push higher)
Gap Date: 7/21/2000
Retrace Date: 1/18/2001
Gap Price: $67.77
Post-Gap Price: $10.46
Percentage Change: -85%
Example: Bemis Company
The next example, GP-9, is a fascinating one, because it illustrates what is known as an island reversal. This kind of reversal is based on not one but two gaps. Island reversals are quite rare and are extremely potent as either bullish or bearish reversal patterns.
In this instance, the stock gapped up on January 11, 2007 to what was then a lifetime high. It then gapped down hard on January 25 on very strong volume. The trading activity between January 11 and January 24 was the “island” left behind by means of the two gaps, and this was an extremely bearish pattern for the stock.
By February 22, the price had retraced to within less than a dollar of the prior gap, and after that, the stock violently lurched up and down – but always lower – until it was beneath $16 on March 6, 2009. Establishing a short position based on a gap can be a good idea, but if you ever get a chance to do so with an island reversal pattern, you will probably understand why these reversal patterns are so revered.
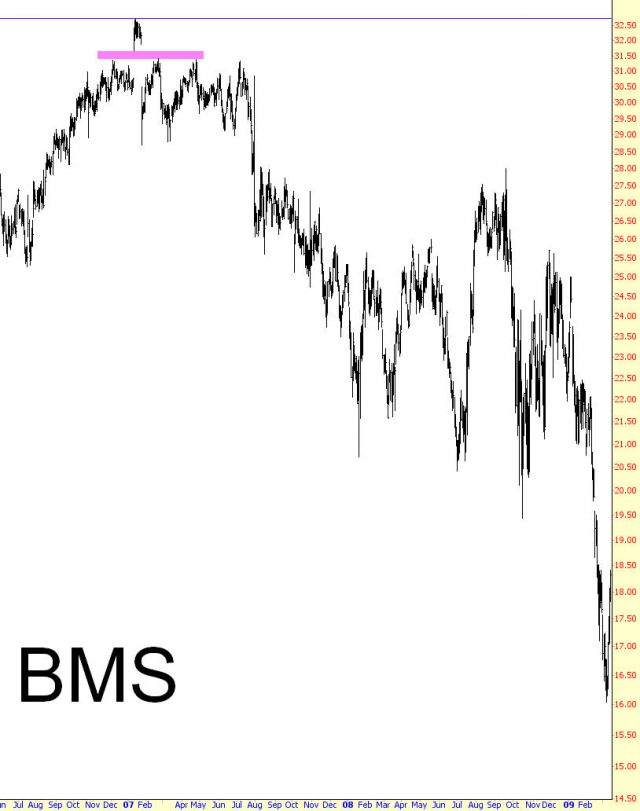
(FIGURE GP-9: Island reversals this well-defined are unusual and often quite potent)
Gap Date: 1/25/2007
Retrace Date: 7/9/2007
Gap Price: $31.11
Post-Gap Price: $20.56
Percentage Change: -34%
Example: Be Aerospace
Sometimes a “shock event” on a stock can take it down so fast that it simply isn’t worth shorting at the rapidly-diminishing price levels. After the September 11 terrorist attacks, the aerospace firm BEAV fell very fast, bottoming within five days of the equity markets re-opening. Those in long positions had very little time to get out, and those wanting to get into a short position would have been wise to stand aside. After all, the stock tripled from its bottom within seven days, and that kind of movement can not just damage an account of a short-seller; it can wipe it out entirely.
By the spring of 2002, the stock had clawed its way back to almost exactly the place where the gap had started, as shown in GP-10. The gap itself had a top of $14.23 (that is, the low price before the plunge was $14.23). The high price by April 11, 2002 was $14.05, tantalizingly close to the gap. Even though it took a couple of months for the stock to really start plunging again, the plunge was sensational, exceeding 90%.
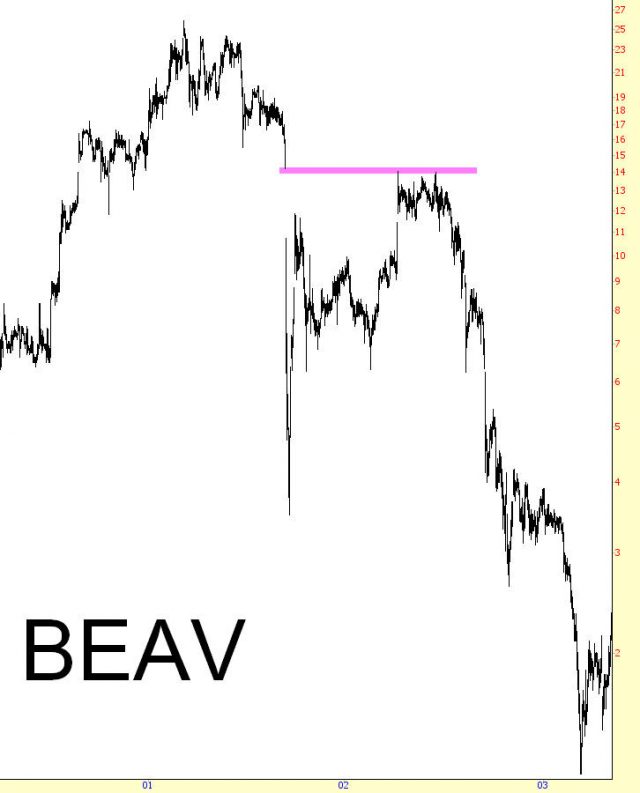
(FIGURE GP-10: The shock-event this stock suffered in late 2001 likely caused many losses among those holding long positions, but those that held on got a second chance to get out at much better prices the next year)
Gap Date: 9/17/2001
Retrace Date: 4/11/2002
Gap Price: $14.05
Post-Gap Price: $1.23
Percentage Change: -91%
Example: Affymetrix, Inc.
There are instances in the market in which a stock experiences multiple price gaps within a reasonably short period of time. Some stock are very “gappy” by their very nature, such as Google (symbol GOOG), which can often surprise investors with un-gaps and down-gaps based on their earnings.
Figure GP-11 shows a stock, symbol AFFX, with three large gaps in a four year period. The first gap takes place on July 22, 2005 and is retracted by November 22 of tha ty ear. The stock goes on to lose 64% of its value. A person with a long-term short in this position might have been stopped out at a more modest profit since the stock picked up a lot of strength between August 2006 and April 2007.
However, the stock gapped down hard again on April 26, 2007, which was retraced by August 8, and the stock began its waterfall decline again falling from about $25 to $17. Before that was over, however, the stock gapped down once more on April 15, 2008, and it kept falling to $1.78 on March 9, 2009 (a date when just about all stocks seemed to pivot around and move much higher).
For a person holding a short, multiple gaps down are nothing but good news. A stock gapping down is going to cause despair and frustration among the stocks’ bulls and is going to egg on the bears. But a stock can only go so low, of course, so a plunge from $52 to less than $2 is probably – as in this case – go0ing to turn around unless the company is headed for outright bankruptcy.
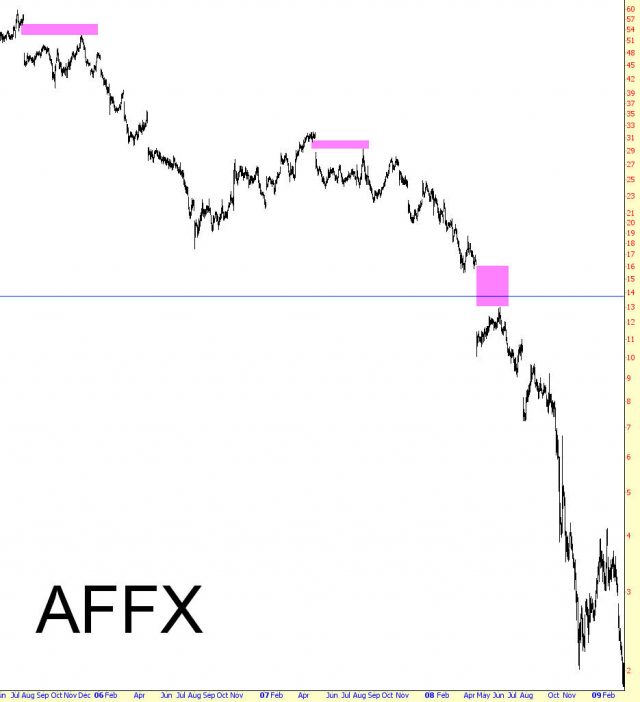
(FIGURE GP-11: Here we see an unusual instance of three consecutive down-gaps)
Gap Date: 7/22/2005
Retrace Date: 11/23/2005
Gap Price: $52.44
Post-Gap Price: $18.72
Percentage Change: -64%
Example: First Marblehead
Another example of multiple gaps down in shown with GP-12. One interesting aspect of these these two gaps is how different their behavior is. The first gap, which happened on April 16, 2007 on very strong volume, retraced by July 11, and the stock spent seven months meandering around a relatively tight price range between about $30 and $40. So in spite of the very large selloff on big volume, the stock was not shocked into a general downtrend. It simply lost some value and tried to build some kind of base afterward.
The attempts at base construction failed in late November 2007, and finally the stock started falling quickly. In the midst of this downfall, on Aprill 8, 2008, the stock gapped down hard again, retracing its drop by August 18th of the same year. The stock was so battered at this point, and the holders were probably so frustrated, there was no meaningful attempt to consolidate at any price level. Instead, the stock lurched more lower, made a modest attempt at a retracement, and then finally reached its nadir of fifty-eight cents on November 20 of 2008.
With the first gap, there were plenty of opportunities for bulls to escape and bears to get on board. With the second gap, unless you were already out (or on board), it was too late. The entire nature of the stock’s behavior had changed, and most days following the second gap were greeted with nothing but selling.
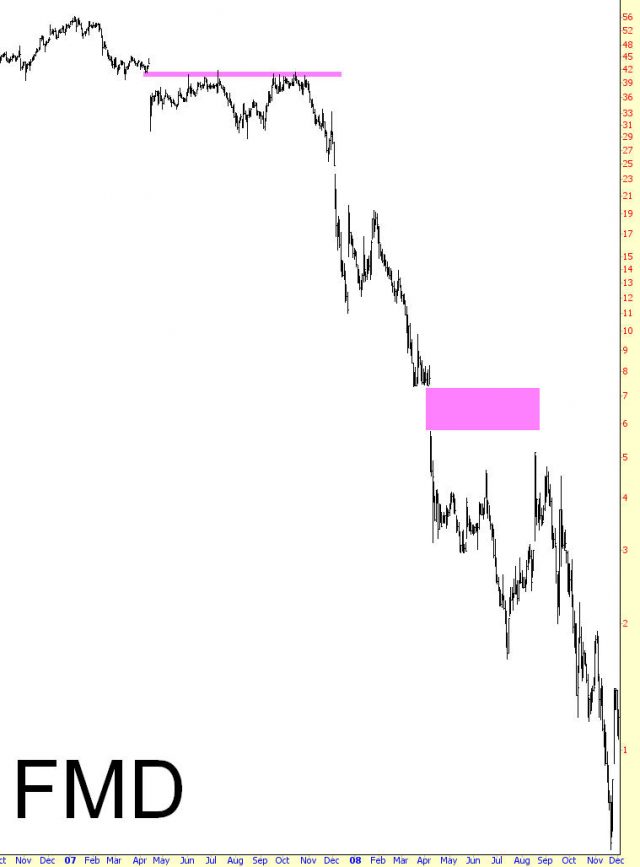
(FIGURE GP-12: This stock was weak on such a sustained basis that it suffered two large down-gaps)
Gap Date: 4/8/2008
Retrace Date: 8/18/2008
Gap Price: $5.14
Post-Gap Price: $0.58
Percentage Change: -89%
Example: Ebay
It is unusual to see a stock engage in a gap-based countertrend rally after a gap down, but Ebay, shown in GP-13, gives us an instance of this peculiar event. It also shows that there are opportunities to make money in both directions, if one is nimble enough.
The stock gapped down on January 20, 2005. There really was no retracement to speak of until a year later. But before that happened, while the stock was crawling down in price, the stock gapped up on July 21, 2005. You can imagine how perplexing this situation must have been. For someone short the stock, it would have been a disconcertingly strong countertrend; for someone long the stock, it would have provided encouragement that maybe the worst was behind them.
What’s fascinating is that both events did retrace. The gap up was retraced by September 21, offering a good short-term opportunity to be long EBAY in the midst of an overall downtrend. More importantly, by January 19, 2006, the stock had retraced back to the gap down, although the severity of the gap still left about a $3 spread between the high price of January 19 and the low price of January 20 the prior year.
From that point, the stock was in such a strong downtrend that it didn’t stop falling until it was in the single digits. Whether or not a person took advantage of both these gaps depends on their timeframe. A longer-term trader probably would have simply waited for the down-gap to retrace, which required a year of waiting but was, in the end, an excellent trade. Someone more aggressive who could afford to watch the markets very close might have been adept enough to short the stock on the gap down and reverse the position on the gap up, reversing the position yet again once the price had clawed its way back up to the $47 level.
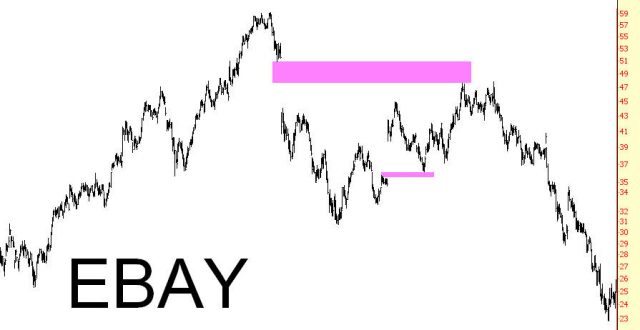
(FIGURE GP-13: There are two opportunities shown here – a bearish one, with the large gap, and a bullish one, with the smaller gap.)
Gap Date: 1/20/2005
Retrace Date: 1/19/2006
Gap Price: $47.46
Post-Gap Price: $22.83
Percentage Change: -52%
Summary
Gaps are the markets way of signaling a big change, but knowing what to do with that change separates profitable trades from losing ones. Those who pile into a rising stock, or dump a stock which gaps down, purely on emotion may find themselves having to sit on a losing position for a while, hoping that things turn around. However, traders who can take advantage of a gap’s likely behavior will almost certainly enter the position at a more favorable price, reducing their risk and increasing their potential profit.
