Some patterns can be quite long-term, spanning years or even decades. The flag pattern is nothing of the sort. It is, instead, a rather short-term pattern typically lasting just a few weeks, and it is a continuation pattern, allowing a security to “take a breath” before moving in its dominant direction
Definition of the Pattern
The first requirement for a flag pattern is that it be preceded by a strong move in the first place. That move can be up or down, but it must be strong and sharp, since the entire basis for a flag pattern is that it represents a brief pause in the action of an overall powerful move. Even though prices may form flag patterns in the midst of markets that are meandering, the fact that they aren’t in the context of a strong move negates their import.
Next, the flag should be countertrend to the general trend. Because of its countertrend nature, the flag should be downward-sloping for a bullish move and upward-sloping for a bearish move. After all, the buying or selling action is supposed to abate during the formation of the flag – often on dwindling volume – and it makes sense that the dominant direction would be opposed while the flag is being formed.
The flag itself is defined as a group of prices that are cleanly bounded by a pair of parallel trendlines. If the lines are converging, the pattern is a pennant, which is covered in a different section. The flag itself shouldn’t be terribly lengthy; a length of three months is probably the longest acceptable timeframe, and a more typical age will be a month or less.
Finally, when the price breaks out of the flag pattern, that breakout should be accompanied with an increase in volume. The trend is eager to resume itself, and after weeks of waiting, buyers (or sellers, as the case may be) should push the equity back into its longer-term trend with an abundance of activity.
Even though flags aren’t particularly big patterns, the moves they portend can be substantial. The distance from the beginning of the broad trend (whether up or down) to the beginning of the flag is sometimes known as the “flag pole”, and its height is the figure you want to use to compute the measured move. That move is calculated by adding (or, in a downtrend, subtracting) the price value from the end of the flag pattern.
For instance, if a stock was trading at between $10 and $12 for a long time, and then it suddenly made a rapid ascent from $12 to $20 before starting its flag pattern, the flagpole would be $8 in height (that is, $20 minus $12, since $12 is the value when the stock changed from trading in a tight range to soaring higher sharply). Let us assume the flag was formed by a gentle down-sloping pattern lasting three weeks that took the price back down, but then the bulls stepped in again on big volume and broke out of the flag at $18. The measured target would therefore be $26, since $18 (the breakout level) plus $8 (the flag pole’s height) equals $26.
Psychology Behind the Pattern
Let’s look at a real-life example of a flag pattern to understand the thinking behind the crowd trading it. Figure FL-1 shows PNM Resources, a stock that until early March was in a very sharp downtrend. The stock bottomed and began an extremely rapid climb. The participants in such a climb would be a combination of those who had bought the stock much earlier and were relieved to see their losses diminishing and new owners that bought nearly the bottom and were delighted at their quick profits. The stock moved from about $5.50 to about $8.50, a “flag pole” with a height of $3. At this point, most people are extremely happy with what has been happening to PNM.
After such a dizzying ascent, selling starts to overcome buying, and the stock begins to ease back. There is no panic selling, however, as the angle of the descent is modest and suggests an orderly taking of profits. There are enough people satisfied with (or uncomfortable with) a 50% increase in price in such a short amount of time that they would rather exit all of part of their position rather than hold out for even bigger gains. Fear briefly overcomes greed, but there is enough sustained interest in the stock to avoid any kind of rapid selloff.
After about a month of moving between $8.50 and $7.25, the “weak hands” have been cleared out of the stock, and it’s ready to resume its strong move higher. It pushes above the flag pattern, and it’s evident to those trading the stock that the consolidation is now over and there is an opportunity for greater gains. Existing owners buy more, and bystanders who don’t yet own the stock finally decide to do so. Once the price exceeds its former recovery high of $8.50, which takes place almost immediately after the breakout, greed overcomes fear once more, and the stock can work its way to its target price.
That target price, $11.25, is the sum of the price at the breakout ($8.25) and the flag pole height of $3. This target is met by July, and there is enough buying to even exceed that target. In the end, this turns out to be an almost perfect illustration of the flag pattern, both in its form and its targeted price.
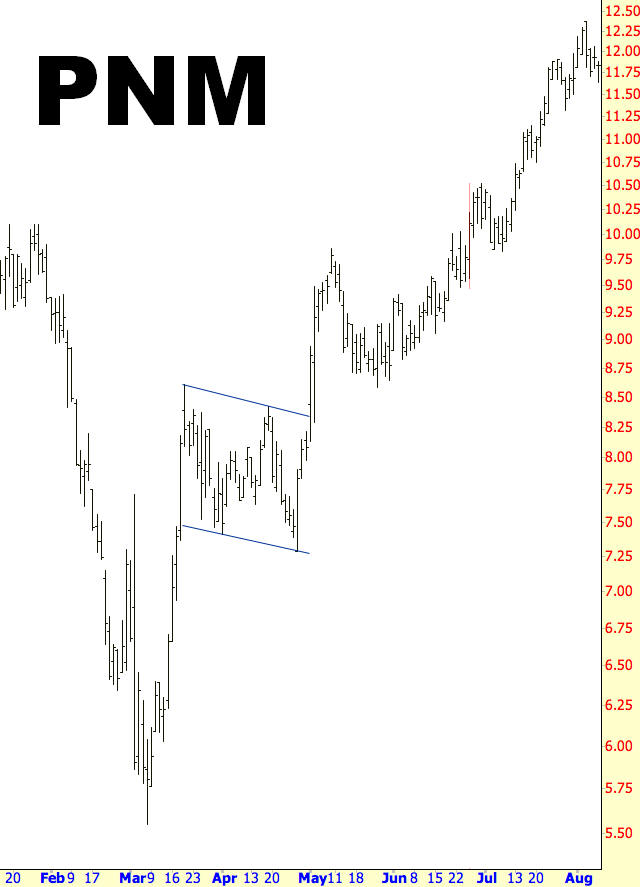
(FIGURE FL-1: This example makes it easy to see how the second “flagpole” height equaled the first)
Example: Sunstone Hotel Investors
Although it isn’t shown in FL-3, the flagpole of this flag started at the low price of $1.87, and the value of SHO moved very fast. The downward angle of this flag is more extreme, but that is not surprising considering how fast the stock moved from $1.87 to $7.81.
The “takeaway” from this chart is that the move preceding a flag may be more dramatic than the moving following it, particularly during upward trends. Stocks climb the proverbial wall of worry, and it can sometimes take months or even years for a bullish move to complete, even if it begins with an exhilarating jump. The target price of approximately $11 was indeed achieved, but it took about eight months to get there after the flag, whereas the price increase prior to the flag took one-quarter of that time.
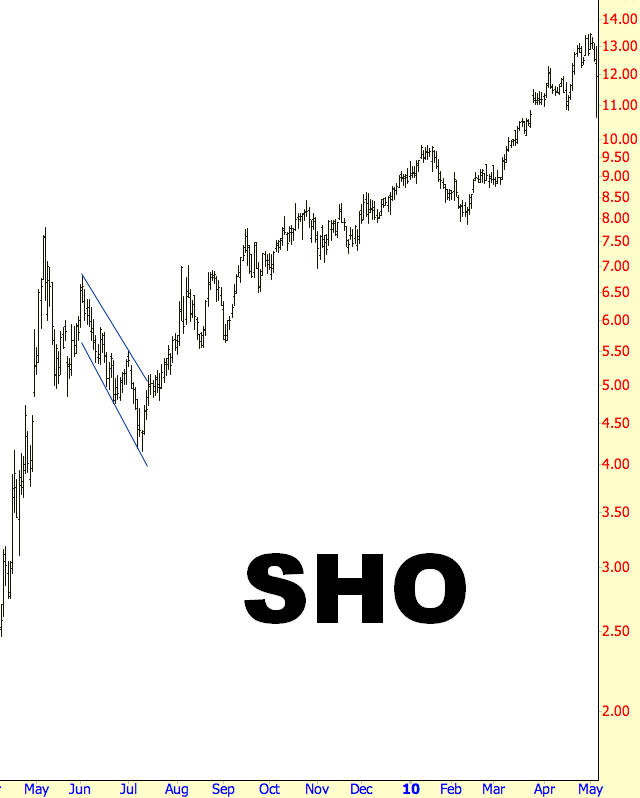
(FIGURE FL-2: The bullish move continued after this flag pattern, but at a more leisurely pace)
Pattern Start: 6/1/2009
Pattern End: 7/15/2009
Breakout Price: $5
Post-Breakout Price: $13.47
Percentage Change: 169%
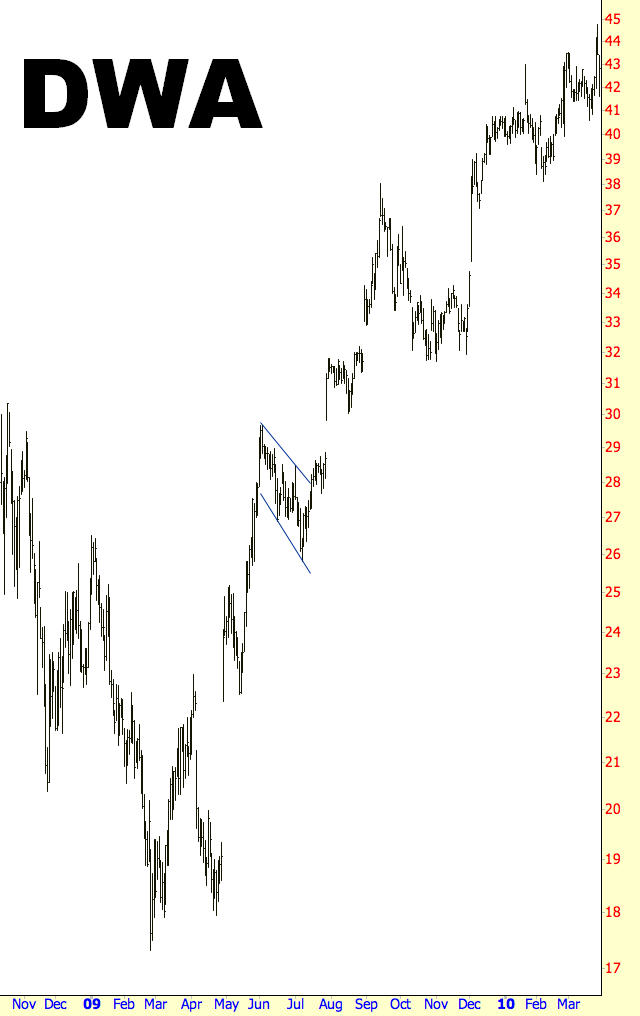
Example: Waddell & Reed Financial
There will be occasions in your charting career when you see a series of flags that happen in succession. This is logical, since a long-term trend might need more than one opportunity to pause and backfill before continuing. It is also valuable to be able to distinguish between distinct flags since it will help you more accurately measure the target move.
Figure FL-3 has one flag marked, but it look at the area preceding this flag, you can see another larger, more sharply-angled flag formed during February and March of 2009. If you were to look at this chart and assume and entire span from November 2008 to July 2009 was the flagpole, the target price would be far too high.
Instead, the first flagpole is from about $8 to $17 (a height of $9) which, when added to the first flag’s breakout of $13, gives a target of $22. When the second flag begins forming (and this is the flag that is marked on the graph), the flagpole ranges from $11 to $22, a height of $11, which, when added to the breakout price of $25, produces a target of $36, which was met by April of 2010.
Discerning these two flags gives you two benefits: first, it lets you have accurate target prices to know when a move has reached its likely potential, and second, it helps you avoid severely overstating where a price might move. These two might sound the same, but the first is a matter of knowing when to exit, and the second is a matter of avoiding a severe misjudgment of a pattern’s potential.
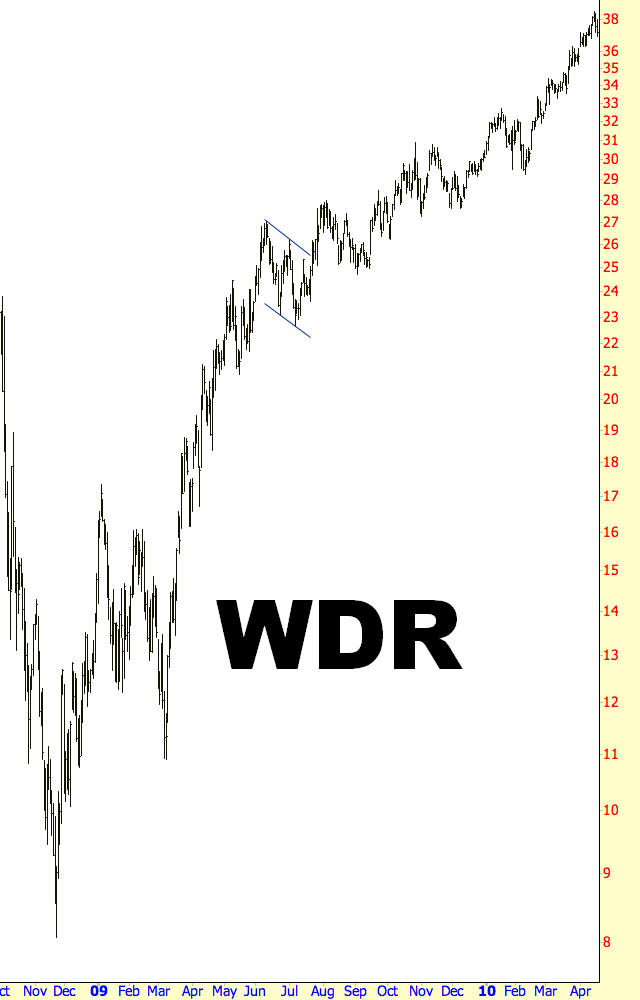
(FIGURE FL-3: Although the angle of the ascent was less sharp after the flag, the target was still met)
Pattern Start: 6/10/2009
Pattern End: 7/23/2009
Breakout Price: $25
Post-Breakout Price: $38
Percentage Change: 52%
Example: Carnival PLC
Most stocks making big moves higher in price will have plenty of times in which the price softens and then ascends again. Not every one of these times represents a flag pattern. In your mind’s eye – and then, with your charting tools – you need to discern the difference between a group of prices which is bounded by parallel lines and a group of prices which is simply going down in an ill-defined fashion.
The price chart for Carnival, FL-4, has four distinct areas in which the price drops substantially, but only the second of these is a flag pattern, and it is marked as such. Although some charting programs, such as ProphetCharts, have built-in tools to automatically find patterns such as flags, you will also find that, over the years, your eyes will get better at distinguishing what is a true pattern and what is simply noise.
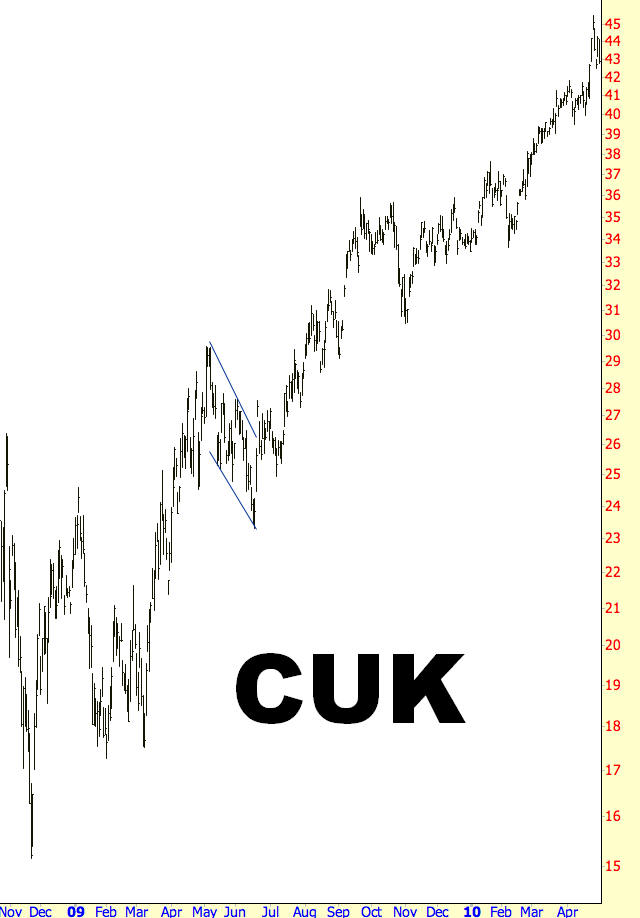
(FIGURE FL-4: The measured move for this pattern was ideal)
Pattern Start: 5/7/2009
Pattern End: 6/19/2009
Breakout Price: $25
Post-Breakout Price: $36
Percentage Change: 44%
Example: Dreamworks Animation
The animation house Dreamworks experienced a very strong rally for most of 2009, and there were at least four big gaps up in price during this rally (gaps are a charting event covered in a different section). Between the first and second gaps, a steeply-descending flag pattern was formed.
Even though the gaps are open, they are still included in the calculation of the flagpole. Using FL-5, Dreamworks’ chart, as our example, the first flagpole ranges from $18 to $29, a height of $11. The breakout point is at about $28, offering a target of $39. The price was bested by the end of 2009, and interestingly, that is also approximately the level where the upward movement began stalling. The gaps were an encouraging affirmation of the stock’s rally, but the flag allowed us to anticipate when the take our profits.
(FIGURE FL-5: This stock had a series of huge gaps higher in price during its uptrend)
Pattern Start: 6/1/2009
Pattern End: 7/16/2009
Breakout Price: $28
Post-Breakout Price: $38
Percentage Change: 36%
Example: Sysco Corp
Although having a target price is a good way to take profits at a non-arbitrary level, the price that a stock might reach could far exceed this target. That is why you may find it prudent to take partial profits at your target price and leave a portion of the position in place with a tight stop, just in case you have the good fortune to enjoy even larger profits.
A fitting example of this is Sysco, shown in FL-6. The price moved from $19 to $23.50, then the flag began forming. After the breakout at $21.50, a target price of $26 was implied. It reached this price, but then it continued into the lower $30s. Keeping, for instance, half of your position even after the $26 target was reached would have permitted you to tack on another $5/share in gains before the move was finally exhausted.
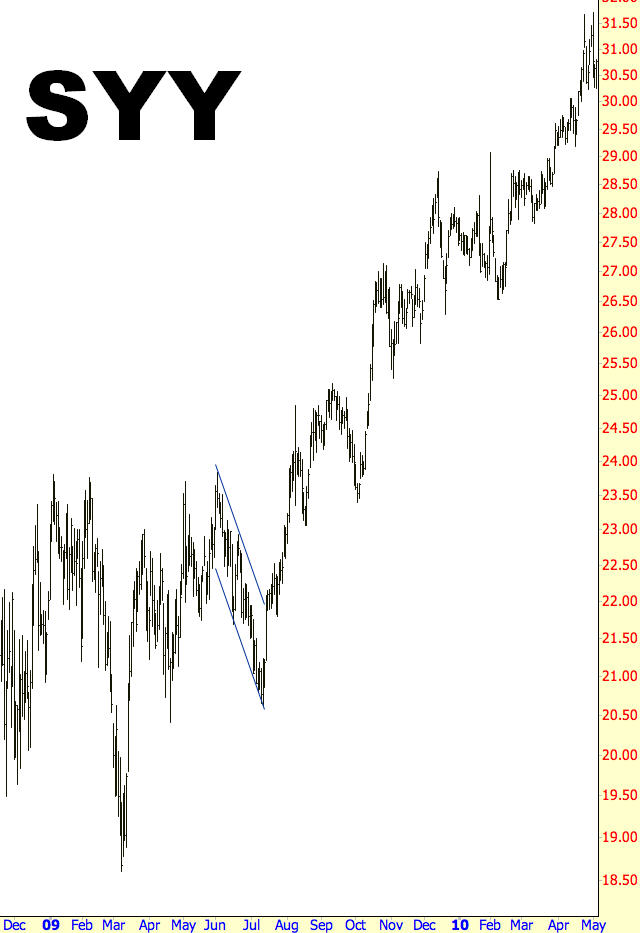
(FIGURE FL-6: The move higher greatly exceeded the target)
Pattern Start: 6/2/2009
Pattern End: 7/15/2009
Breakout Price: $21.50
Post-Breakout Price: $31.17
Percentage Change: 45%
Example: DTE Energy
Flags can be continuation patterns for stocks that are falling as well. Figure FL-7 offers an example of this with symbol DTE, and the same rules that apply to flags for bullish stocks apply in reverse to flags for bearish stocks.
The flag highlighted in this chart is at the “half-mast” point between the extremes of the graph. In other words, the flag poles on each side of the flag are both about the same height, as you would expect from this pattern. The stock’s fall started at about $47, and the flag started forming at $38, a price $9 lower. The flag pattern finished about a month later at $36, suggesting a target low of $27, which was reached and exceeded.
Take note how the flag itself is slanted upward versus the downward-slanting flags of the bullish charts in this section. This agrees with the concept that the flag is a countertrend resting period within the context of the larger move. The stock price briefly fights its way higher, but the pattern eventually succumbs to the overall selling pressure of the trend and the price decline resumes as before.
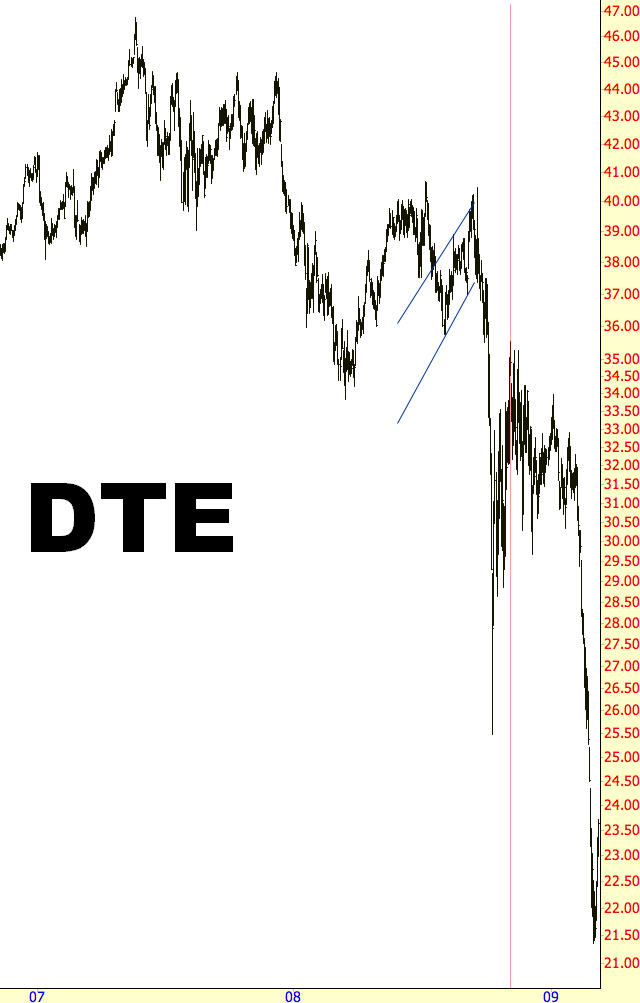
(FIGURE FL-7: This equity looked like it might be recovering in mid-2008, but the failure of the flag confirmed that the general downtrend was still on)
Pattern Start: 7/23/2008
Pattern End: 9/19/2008
Breakout Price: $36
Post-Breakout Price: $25
Percentage Change: -31%
Example: Sinclair Broadcast
The time-length of the flags in both FL-7 and FL-8 illustrates how much shorter bearish flags can be when compared to bullish flags.
The stock’s fall began on October 5, 2007 at a high price of $11.38. When the flag pattern started on August 6, 2008, the price was $6.31, suggesting a flag pole height of a little more than $5. The flag pattern was complete on September 25, 2008 at a breakout price of $5.60, suggesting the bottom of the rightmost flag pole would be an alarming sixty cents.
Amazingly, the price got very close to this target. The price bottomed at eighty-three cents on March 17, 2009 and then commenced a huge reversal in price of greater than a thousand percentage points. As small as the flag was, particularly in the context of a multi-year drop in price, its ability to serve as a measuring tool for the ultimate low was remarkable.
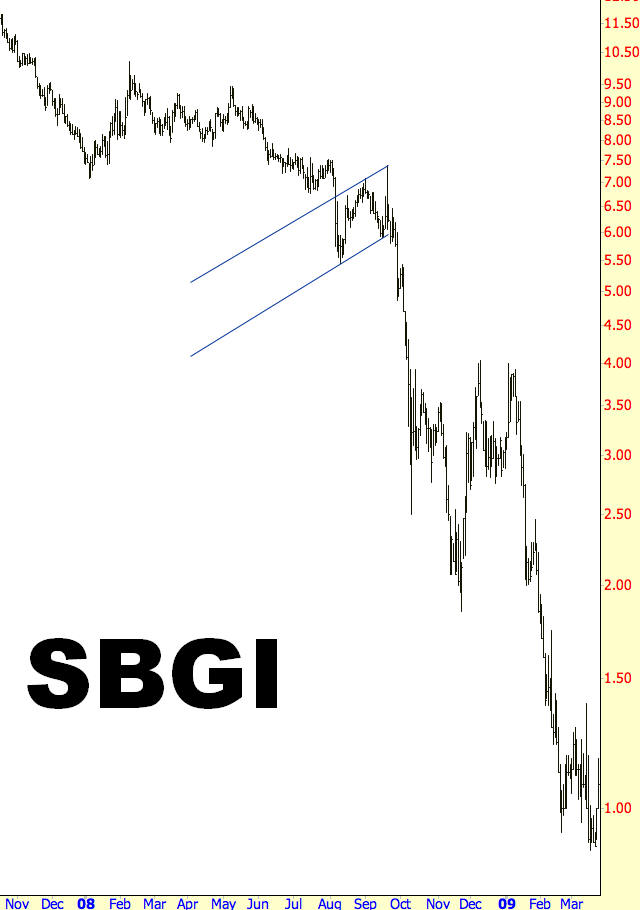
(FIGURE FL-8: This flag was very short-lived, because the selling pressure was so intense that it did not take long for it to resume with full force)
Pattern Start: 8/6/2008
Pattern End: 9/25/2008
Breakout Price: $5.60
Post-Breakout Price: $1
Percentage Change: -82%
Summary
The flag’s power is in its ability to predict a target price. Flags can be difficult to spot when they are being formed, but when you are tracking a stock that has just complete a very large move up or down, you should be on the look-out for a flag, which serves not only as a stopping point but also a projection method.
Remember, flags can appear in either up or down markets, but they need to run contrary to the broader trend. They also need to enclose the price action between parallel lines lasting not more than three months. If your observations match these parameters, you will have a valuable ally with respect to determining the next important price for your security.
