This page will help you understand price change charts, which is a special mode in the SlopeCharts product. This will be of particular interest to you options traders. This feature is available exclusively to Platinum level members, and you can get immediate access by upgrading here.
What we’ve done is merged together historical stock data with earnings announcements so you can see how a stock behaves as it approaches its earnings day and then immediately afterward.
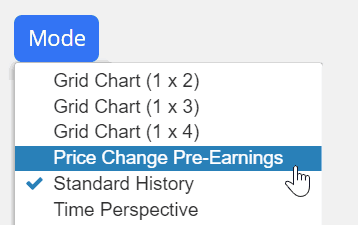
By default, we show you every day for twenty days in advance of earnings, as well as five days after earnings (you can change how many days via the dropdown). To access this style of chart, choose Price Change Pre-Earnings from the Mode menu in SlopeCharts.
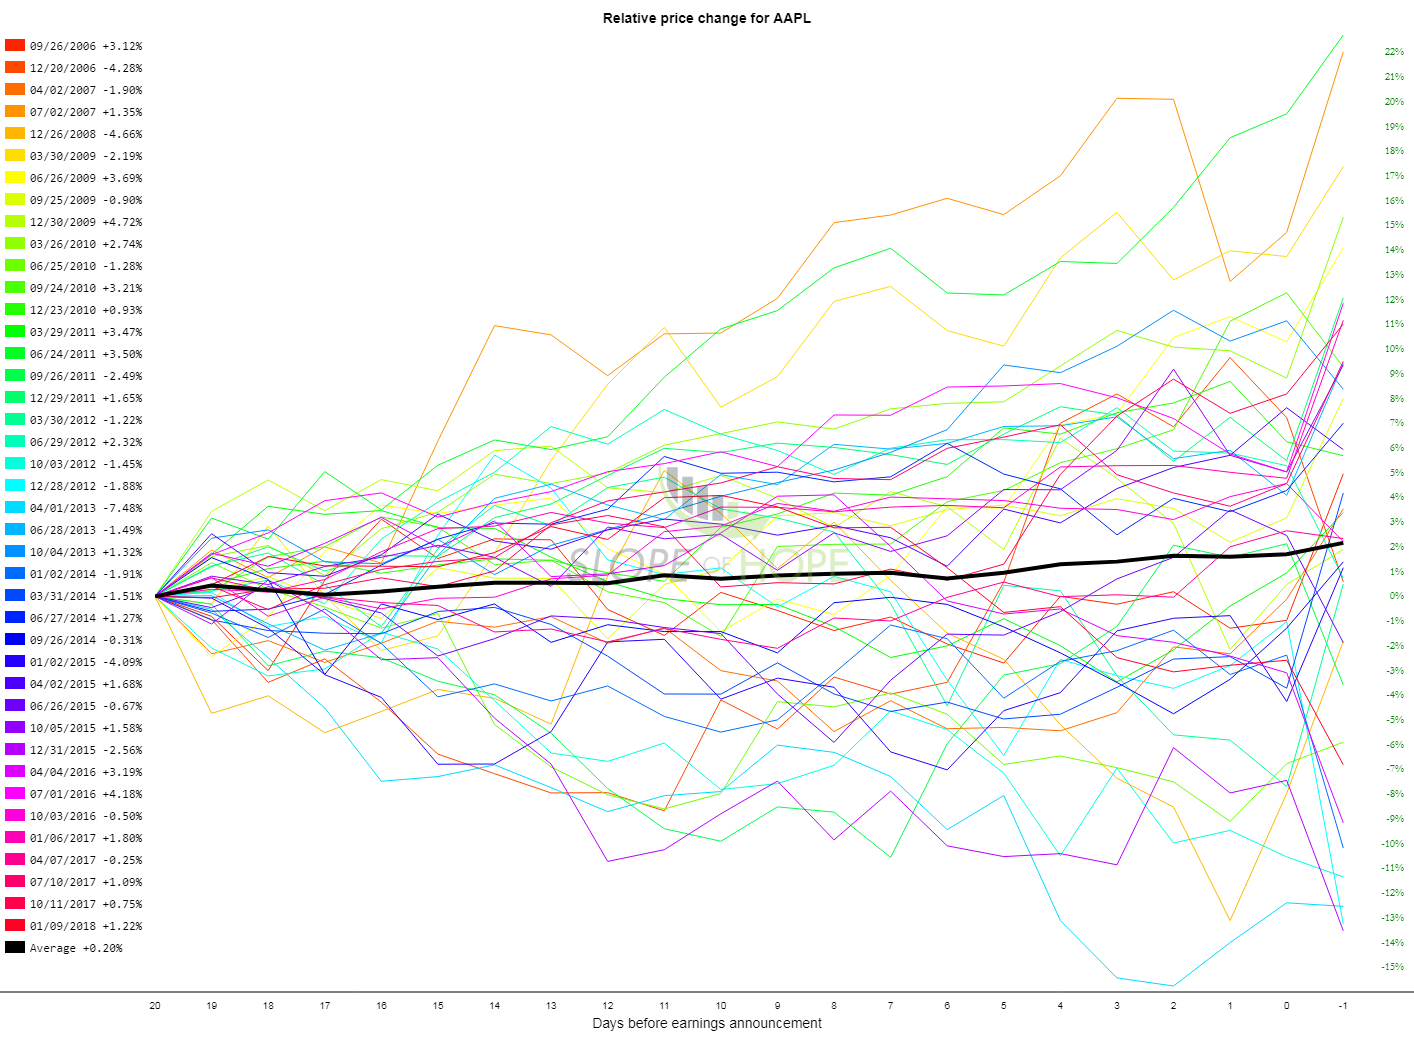
You will then see a chart similar to the one below. On the left side is a Color Legend showing you the earnings date corresponding to the line color. In the chart area is a series of percentage charts showing what the stock did as it approached “day 0” (the earnings date), with the black line being the average. As you move the cursor left and right, you can see the percentage change day to day displayed next to the legend.
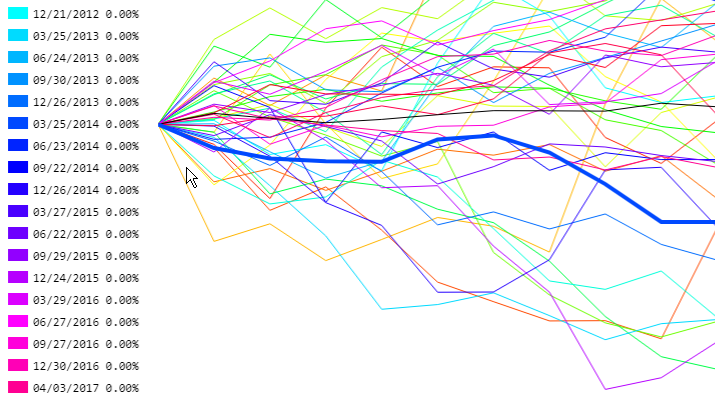
If you want to concentrate on any particular earnings, you can click on that item in the legend, and that particular percentage line will be boldfaced for clarity.
You can exit this mode by choosing any of the other offerings from the same Mode menu.
