Timely alerts are crucial to exploiting trading opportunities, and being able to set a notification based on something interesting you see on a chart is a fast and purely visual way to establish a virtual “robot” to keep an eye on the price action and let you know if something meaningful happens.
SlopeCharts features chart-based alerts so that you can establish a rule set of potential events in your charting universe about which you can be informed. This feature is exclusively for our Gold and Platinum members, and if you are interested in a membership, you can learn about them here. With chart-based alerts, you can monitor circumstances with respect to horizontal lines, trendlines, and channels.
Setting a Horizontal Alert
The simplest drawn object upon which an alert can be based is the horizontal line. This line is crucial for, naturally, price breaks above a certain level (bullish) or below a certain level (bearish).
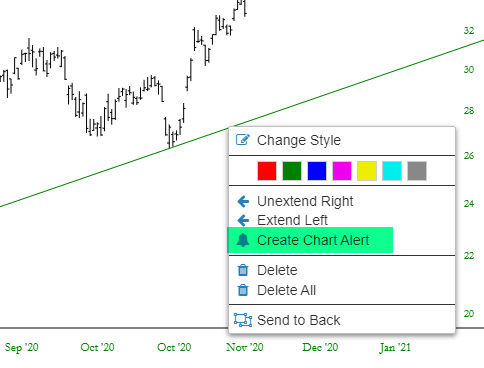
Using it could not be simpler. When you right-click on a horizontal line, you will see a new choice called Create Chart Alert:

This feeds the SlopeAlerts system with (1) the symbol and (2) the price level. At that point, all you need to do is set the condition.
This is a big time-saver, and it marries the charting with the alert system in a seamlessly visual way. Something vastly more complex on our end, but also singularly helpful, is trendline-based alerts.
Trendline and Channel Alerts
Let’s take a real-life example of an ETF I follow, which is the Brazil ETF, symbol EWZ. There is nothing particularly tradeable about this chart, but I believe a break above the horizontal line would be bullish and a break below the ascending trendline would be bearish.

You already know how to set up the horizontal line alert. To set up an alert for the trendline, you would right-click on the line and see a menu item called Create Chart Alert.
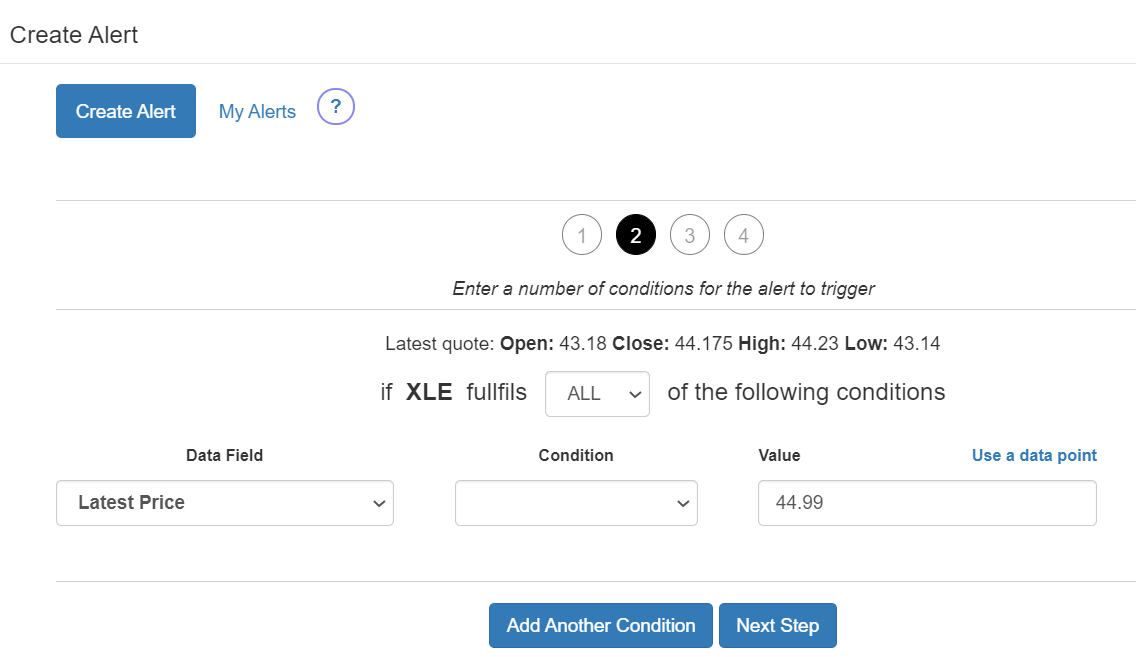
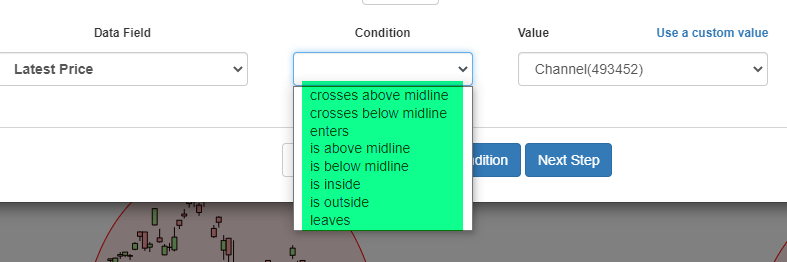
This presents you with a dialog box. The symbol is already filled out, as is the trendline rule. The only thing you need to selection is a Condition. In this case, we would choose “crosses below”, since we want to be alerted if the price ever crosses below the selected trendline.
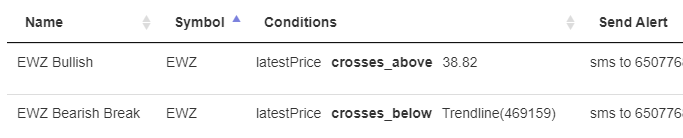
Thus, we have set up two important alerts for this one symbol: a bullish alert (based on the horizontal) and a bearish alert (based on the trendline). This succinctly illustrates how helpful chart-based alerts are, since otherwise you would have to constantly check that chart to see if the price had crossed either line, which would of course but a ridiculous waste of time and highly prone to missing opportunities.
Each drawn object has its own set of parameters. The most complete one is for channels, as shown here:
Alerts and SlopeCharts
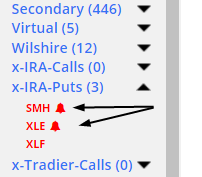
The SlopeAlerts system is well-integrated with SlopeCharts. For example, there is an alert icon displayed next to any ticker symbol which has one or more alerts established.
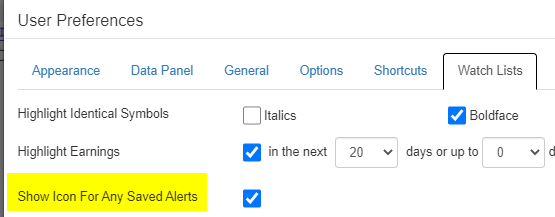
You can control whether or not you want this icon shown by way of the Preferences dialog box, although we set the default to “checked” since it seems useful to actually know about the existence of alerts.
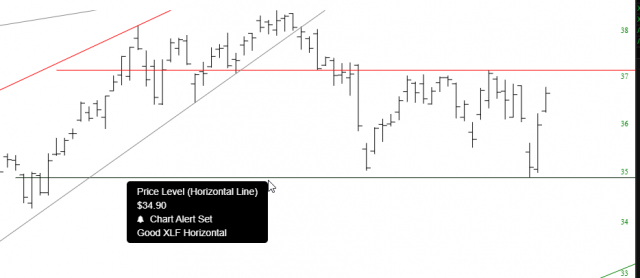
You can also get details about any alert by pointing at the drawn object.