Date Analysis is a button located at the top of SlopeCharts only when you are in Time Perspective mode. (As a reminder, this is a premium service, available to Bronze, Silver, Gold, and Platinum members). You can watch a video about this feature here.
When you click the Date Analysis button, you are presented with a wealth of information, answering such questions as:
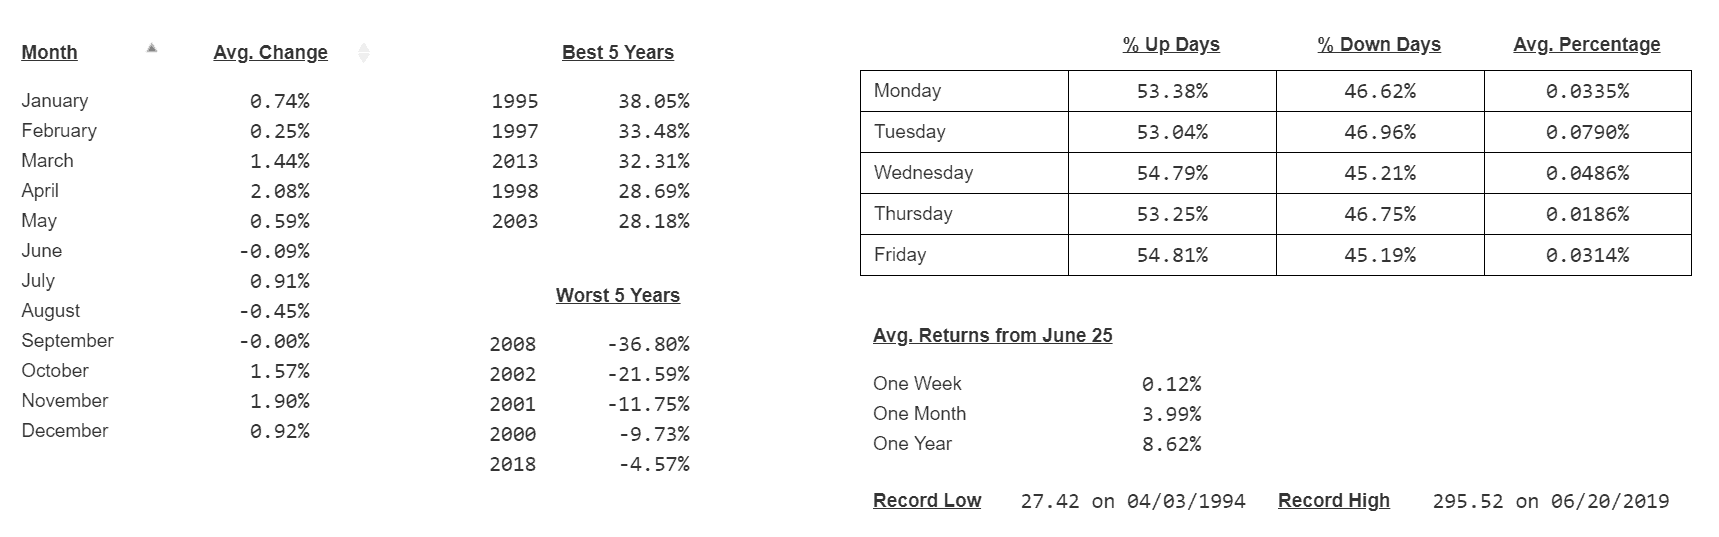
- What was the average performance for this instrument for each month of all the years it has existed?
- What months are worst and best? (You can sort the columns).
- How does this instrument behave on Monday, Tuesday, Wednesday, Thursday, and Friday?
- What percentage of those days of the week are losers and winners? What’s the average change during each of those days?
- What’s the record high? When did it happen?
- How about the record low?
- What are the best five years, and what were the changes?
- How about the worst five years?
- What is the typical performance for this instrument one week, one month, and one year from now?
Here’s the SPY for instance (as always, click for better viewing):
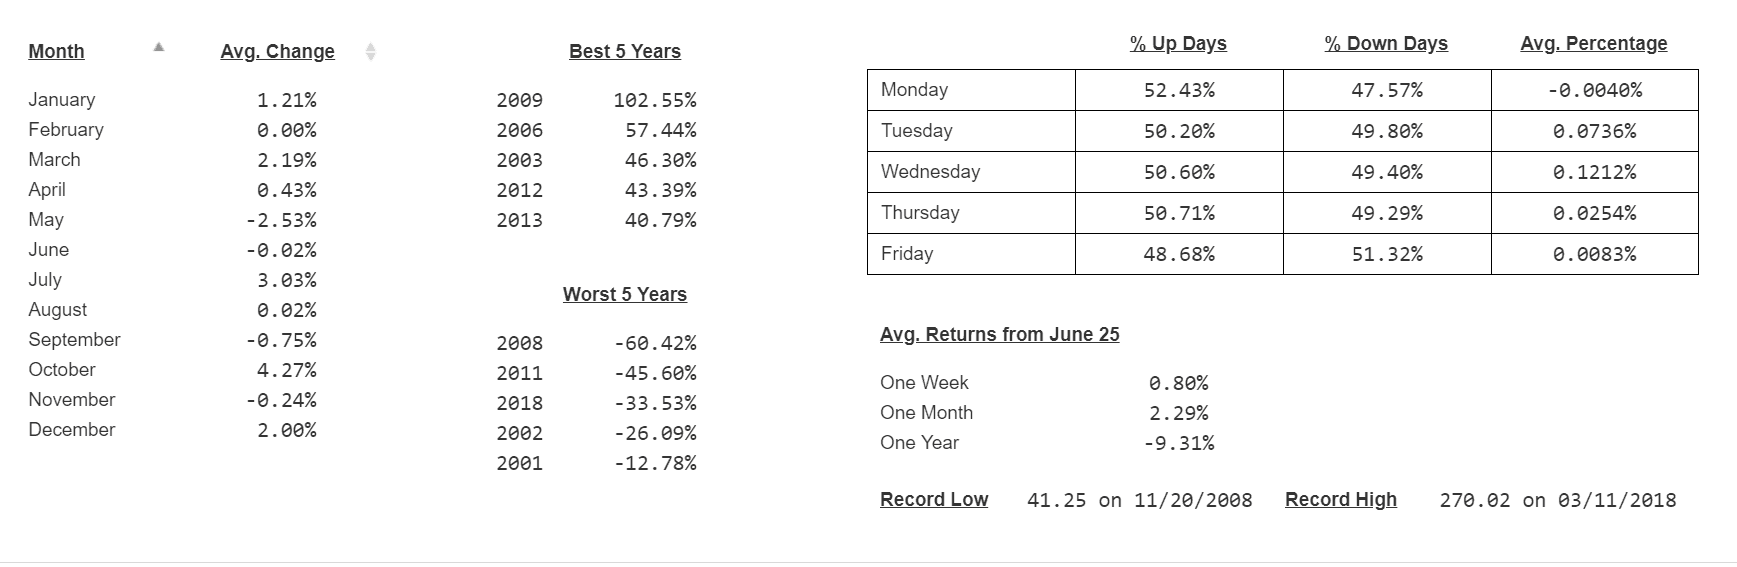
And Goldman Sachs:
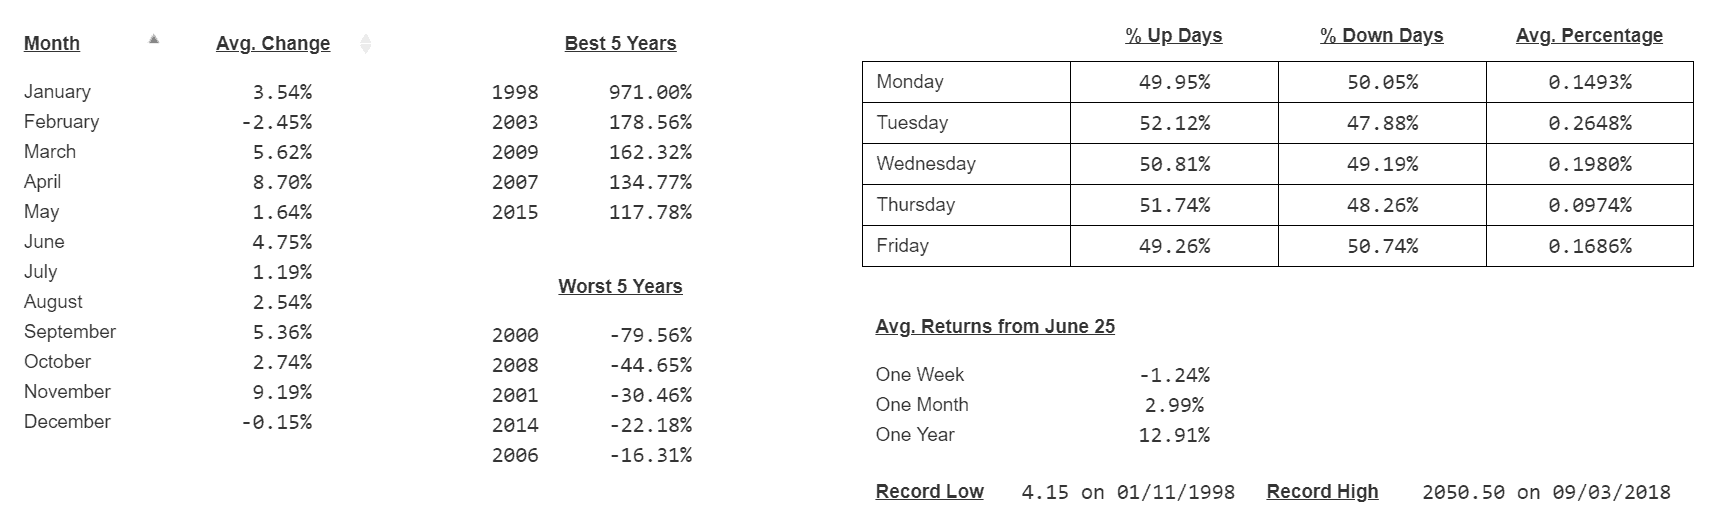
And for some real “extremes”, Amazon:
You can also get instant access to the Date Analysis dialog box by checking the calendar SlopeLink icon at the top of SlopeCharts.
