When price bars are confined by an ascending trendline beneath and another trendline above, and these lines converge on the right side, this is called an ascending wedge. The pattern highlights price action which, although moving higher, is becoming increasingly confined. Because the lower trendline is the most vulnerable to being violated, this pattern is a reliable bearish indicator when and if the price bars slip beneath support. This pattern has a close relative in the form of the Descending Wedge, which is covered in another section.
Definition of the Pattern
The pattern requires just two lines: both of them are ascending, but they are not parallel. Instead, they converge on the right side, although the price bars may break beneath the lower trendline well before this intersection.
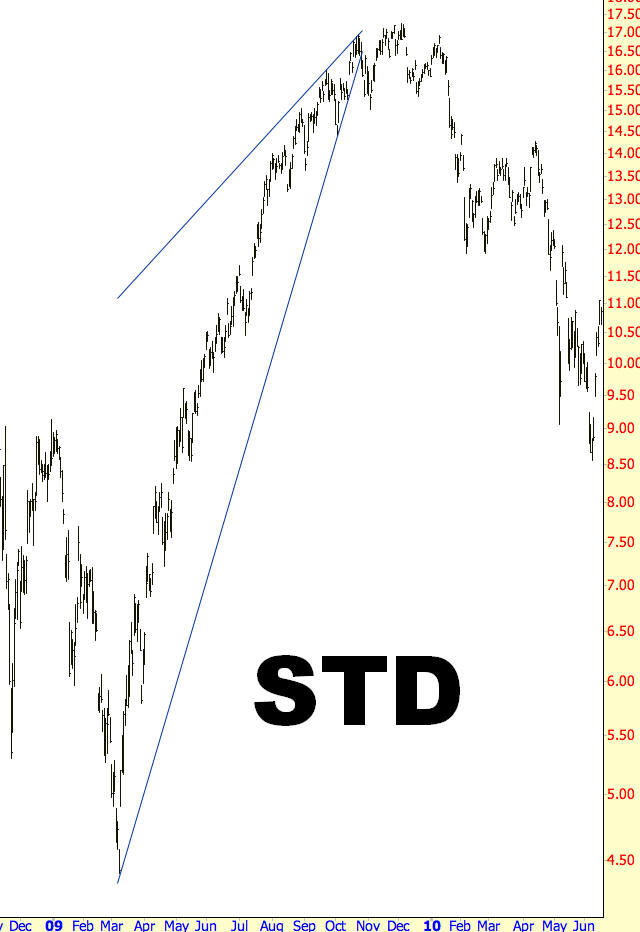
Banco Santander, which went down 44% in price after its ascending wedge was broken. Take note that the price didn’t just plunge straight down after the pattern broke. On the contrary, the stock went on to a new high a few weeks thereafter. However, the pattern’s long formation and break to the downside was an important harbinger of the forthcoming movement of the stock, which was decidedly to the downside.
Psychology Behind the Pattern
Because the prices are generally ascending during the formation of an ascending wedge, holders of the stock are increasingly optimistic and bullish about its prospects. The nature of this pattern, however, is one in which the strength of the movement higher loses energy until such time as the supporting trendline can no longer bear the “weight” of those who want to sell the stock.
The tell-tale sign of this pattern is the upper trendline, because the distance between the “higher lows” of the lower trendline and the “higher highs” of the upper trendline becomes more and more narrow. Buyers simply are unable to give the stock as much lift with each successive push higher, and once the price breaks beneath the lower trendline, the mass of buyers (who until this time were happily watching their profits increase) may make a rush for the exits by way of sell orders.
Even if such a stampede doesn’t take place the fact is that the cleanly-defined uptrend has been broken, and the stock is vulnerable to a sell-off, since those following the trend no longer have a rational technical reason to hold on. This temptation to sell can become widespread, and if people start acting on that temptation, then the selling can feed on itself.
Example: Arkansas Best
Here in AW-2 we have a simple example of an ascending wedge. The lower trendline spans from April to September of 2009, and the resistance trendline above it is at a less sharp angle. It would be many month before these lines would converge, but as long as the price breaks out of the pattern before this intersection, the pattern can be considered complete.
Although this stock fell from about $29 to $24 after the initial break, it would take several months of meandering before it finally dipped below $19 in the summer of 2010. The important thing to note about this chart is that the broad direction of the stock changed, and that change was signaled by the termination of the ascending wedge.
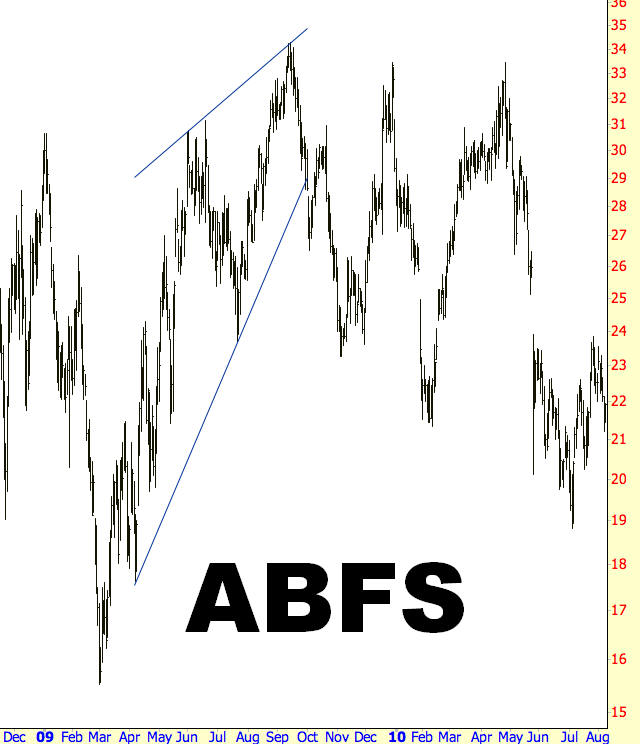
Pattern Start: 4/7/2009
Pattern Break: 9/30/2009
Break Price: $29
Post-Break Low: $18
Price Drop: 38%
Example: On Assignment, Inc.
Symbol ASGN, charted in AW-3, illustrates a more dramatic plunge following an ascending wedge, and there is no retracement following the price break, meaning only those who were already in the trade (or got aboard quickly) reaped the full benefit of this drop; others didn’t have a second chance.
The ascending wedge can act as a reversal pattern (changing a bullish uptrend to a downtrend) or a continuation pattern (representing an upward pause in a general downward-moving trend). For ASGN, this wedge was a continuation pattern, since the stock had been falling already during 2007. The stock made an impressive countertrend rally from about $4.75 to about $9.50, the it broke the uptrend at about $9. From there, it dropped almost to penny-stock status, losing 86% by late February of 2009.
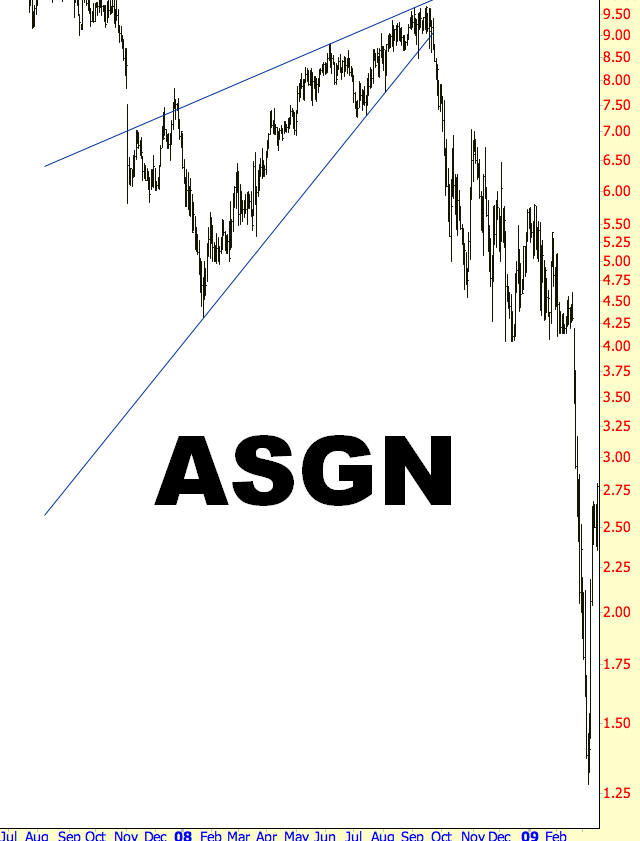
Pattern Start: 1/24/2008
Pattern Break: 9/23/2008
Break Price: $9
Post-Break Low: $1.30
Price Drop: 86%
Example: Duke Energy
A very clean example, with numerous touchpoints, is provided in AW-4. What owners of such a stock want to see during a pattern like this is for the uptrend to remain intact for a long time. Instead, the pattern went on for about four and a half months before failing. Those who are long such positions would be wise to exit such positions during such a break. Even if the fall takes some time to unwind, as it did here, it is unlikely that falling below an ascending wedge is going to mean anything positive for prices until a clearly-defined bullish pattern has had time to form.
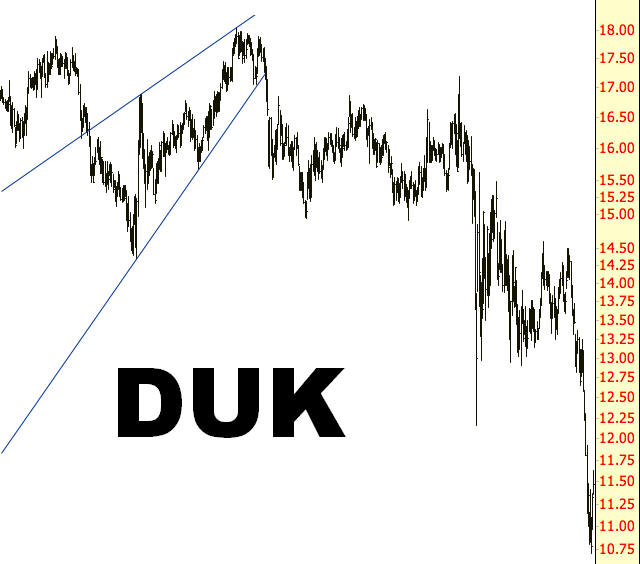
Pattern Start: 8/30/2007
Pattern Break: 1/17/2008
Break Price: $16.50
Post-Break Low: $10.50
Price Drop: 36%
Example: Emulex Corporation
Using measured targets can be a risk-reducing way of taking profits off the proverbial table when you are trading, but as mentioned elsewhere it may be best, depending on your tolerance for risk, to only take partial profits when a simple measured target has been achieved and leave the balance of the position in place (using frequently-refreshed stop-loss levels).
The standard for measuring price moves is to take the extremes in price of the pattern – in this instance, $13 and $17 – and compute their difference. Next, you subtract this difference from the breaking point, which is $15.50. That yields a price target of $11.50, which is relatively modest but which makes sense, considering the pattern’s small size. However, the stock kept falling to $4.50 in a relatively orderly series of lower lows and lower highs. Even if profits were taken on a portion of the position once $11.50 was reached, the trade overall would have been much more profitable by simply keeping the stop-loss fresh and letting the stock’s downward movement reach its potential.
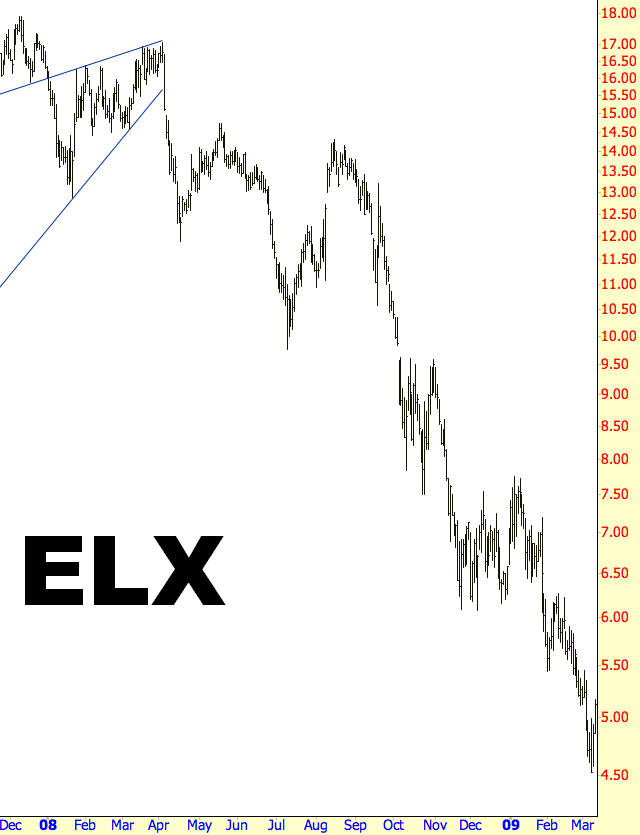
Pattern Start: 1/2/2008
Pattern Break: 4/4/2008
Break Price: $15.50
Post-Break Low: $4.50
Price Drop: 71%
Example: Tenneco Inc.
The final example in this section, AW-6, is the most dramatic of all with respect to percentage change. The upper trendline had four clear touchpoints where the price was trying to push higher, but it could not get past the ascending line of resistance. The lower trendline had three touchpoints, the final of which failed and permitted the stock to drift sideways for a couple of weeks.
Once outside the confines of the pattern, the price began falling heartily from about $26 to about half that price. At that point it stabilizing for over a month, giving panicked bulls and opportunity to either make an exit or, for those so inclined, buy more of a stock that now seemed to be “on sale.” Regretably for those with long positions, the selling was not over, and the downtrend resumed in an even more powerful fashion until a full 98% of the stock’s price at the pattern breakdown was eliminated.
It is very rare to see a stock move this dramatic, but the very well-defined ascending wedge gave a strong sell signal once the price pattern was broken.
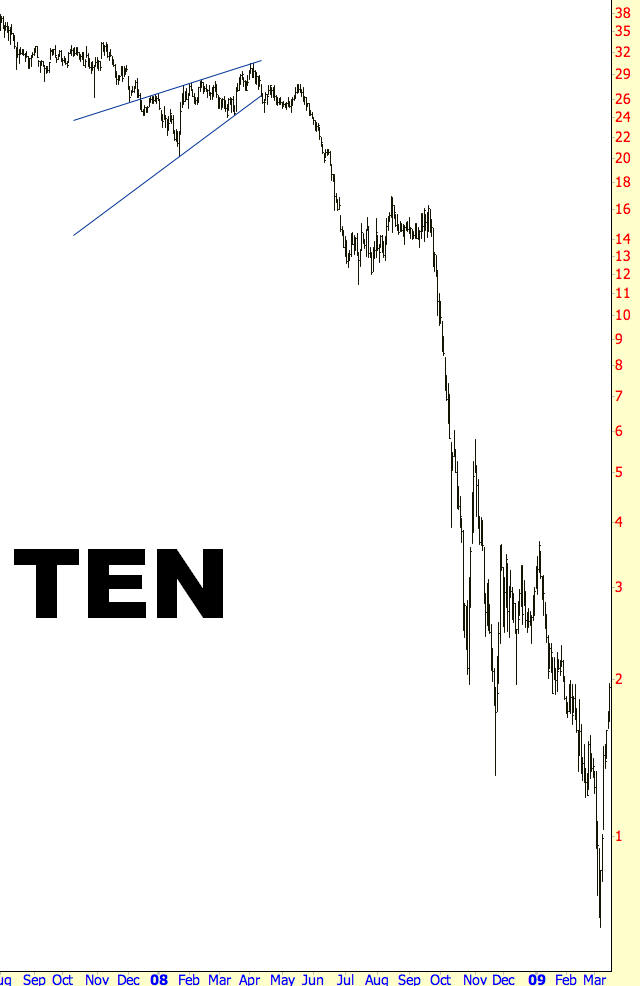
Pattern Start: 12/28/2007
Pattern Break: 4/11/2008
Break Price: $26.50
Post-Break Low: $0.50
Price Drop: 98%
Summary
Wedges can be one of the easier patterns to spot, but they can also be one of the more challenging to trade. Unlike patterns with more clearly-defined zones of support and resistance, the ascending wedge can allow prices for drift for weeks or even months after the pattern has been complete. In most instances, however, even a stubborn stock that is trying to push higher will not exceed its peak price point from the pattern itself, and you can remain in the short position even while the stock bides its time. As long as the pattern is well-defined and is evidently broken, you can consider a price failure beneath an ascending wedge to be a reliably bearish trading signal.
