The rules that apply to the ascending triangle can simply be turned upside-down in order to understand the nature and parameters of the descending triangle, its opposite. This pattern is defined as having a horizontal line, representing the supporting price level, and a descending trendline, which constitutes the top line of the triangle. As with its twin, the descending triangle is also known as a right angle triangle, since a line connecting the leftmost points of the existing lines would complete the three sides, and a right angle would exist in the lower-left corner of the formation.
Definition of the Pattern
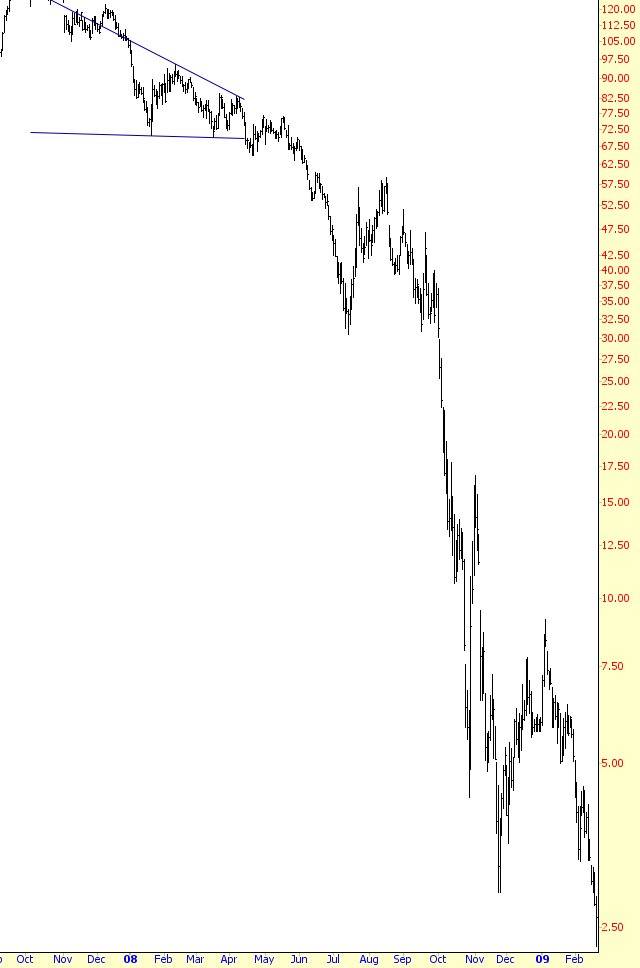
Las Vegas Sand, experienced a breathtaking 98% drop in value after the completion of its descending triangle. There is a horizontal line (the lower one) at about $70, and there is a descending trendline, representing resistance, showing a series of “lower lows” in price. The horizontal line represents support, and after it is broken slightly, there is still enough strength from the buyers to push the price a little higher and back within the confines of the triangle.
A couple of weeks later, the stock starts falling hard, and then it regains its strength and ascends to just beneath its former support level (which is now resistance). When such an opportunity comes, this is the perfect time to short the stock, because the pattern has already failed, the weakness has already been illustrated, and the stop-loss price is well-defined (in this instance, since the stock price has already taken a significant dip down, any price above the resistance level would be a suitable stop-loss basis).
After this retracement, the stock begins tumbling preciptously. Of course, not many stocks move down with this much vigor, but this illustrates how a descending triangle can be a harbinger of serious price weakness.
As with the ascending triangle, the descending triangle is a continuation pattern, meaning that it is effective in a market that is already in a downtrend. It is a bearish pattern, so it must be used within the confines of a bearish trend. For the purposes of measuring a target, you can take the height of the triangle and subtract it from the lower line (which is the supporting horizontal line). Thus, a triangle ranging from $50 to $40 has a height of $10 and thus a target price of $30 (the horizontal line, $40, minus the triangle height, $10, yields the $30 target).
Psychology Behind the Pattern
As a continuation pattern, a stock forming an descending triangle is already in an downtrend and will have a relatively nervous and uncomfortable group of owners (excepting, of course, those already short the stock).
The stock descends, reaches a certain price level, and moves higher. The point where it stopped falling is a support level, and it will be the first touchpoint of the horizontal support line that will later become clear. The bounce higher is substantial, as buyers rush in to buy a stock that now seems “cheap.”
The buying dries up, and the stock starts selling off again, once again reaching the support level. Buyers once again enter the picture (or frustrated short sellers decide to cover), and the price again moves higher, but not as high as the last time. We have our first “lower low” of the descending resistance line. The stock is slowly weakening.
For a third time, the price drops to the support level. Owners of the stock are getting increasingly uncomfortable. Their stock is threatening to break support, and when it gathers its strength, it is doing so with diminishing gusto. The price pushes higher, going up only slightly this time, not even managing to reach the descending resistance line.
At last, the stock pierces support. A few bargain hunters jump in, pushing the price above the line for a few days, but the selling pressure overcomes these buyers, and the stock begins falling in earnest. The selling picks up speed, as frustrated owners throw in the towel and add to the selling pressure.
Example: Geomet, Inc.
Another dramatic example of the descending triangle’s bearish potential is revealed here forming a triangle between the prices of $6 and $10. The price drops quickly, recovers for several weeks, but then begins a waterfall decline into sub-$1 territory. As with the ascending triangle, just because a price re-enters the triangle zone after a breakaway movement does not negate the pattern. In fact, it may provide an opportunity to increase the size of your position at even more attractive prices.
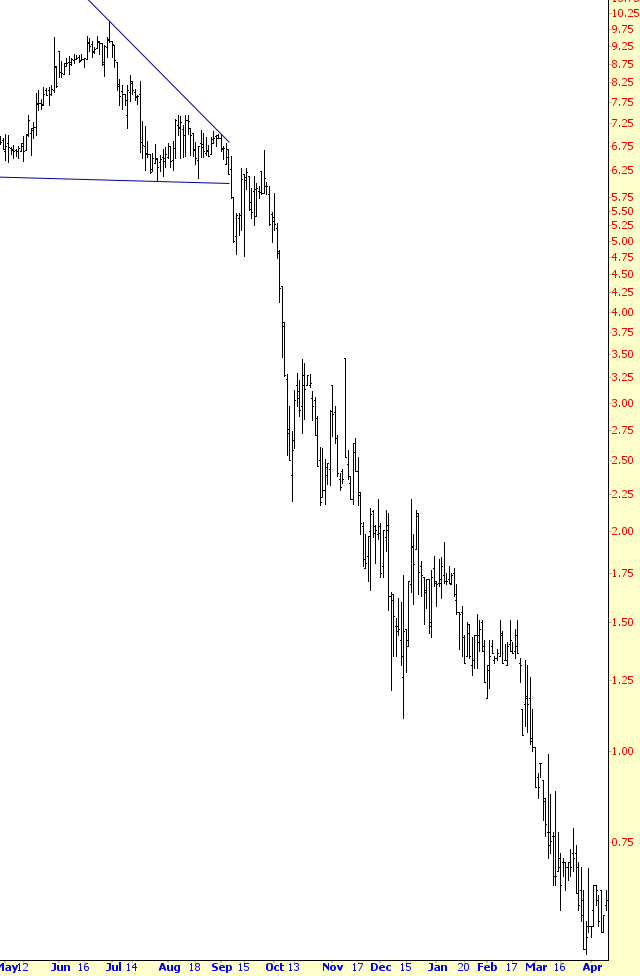
Pattern Start: 3/26/2008
Pattern Break: 9/8/2008
Break Price: $6
Lowest Price: $0.50
Percentage Change: -92%
Example: Novellus Systems
Where a stock breaks away from its triangle varies; sometimes the price falls about halfway along the triangle’s formation, and other times it may wait until where the two lines converge into a point. It’s normally best to see the breakdown take place between halfway and two-thirds of the way along the triangle’s horizontal axis.
This shows a price breakdown that took place earlier. It is also an interesting example since the upper line was briefly penetrated by an “overshoot”. Even if you want to be a stickler for never having a price cross above or below a line (except for the breakout), there are still two touchpoints on the upper line that follow this overshoot.
The range of the triangle is from about $25 to about $31, suggesting a target price of $19. The stock falls to this target and then rises powerfully to nearly $24, so a trade based on this target would have been a clean, profitable one. The stock does weaken after that retracement, however, ultimately falling to nearly $10, representing an overall 60% diminishment in price after the pattern’s completion.
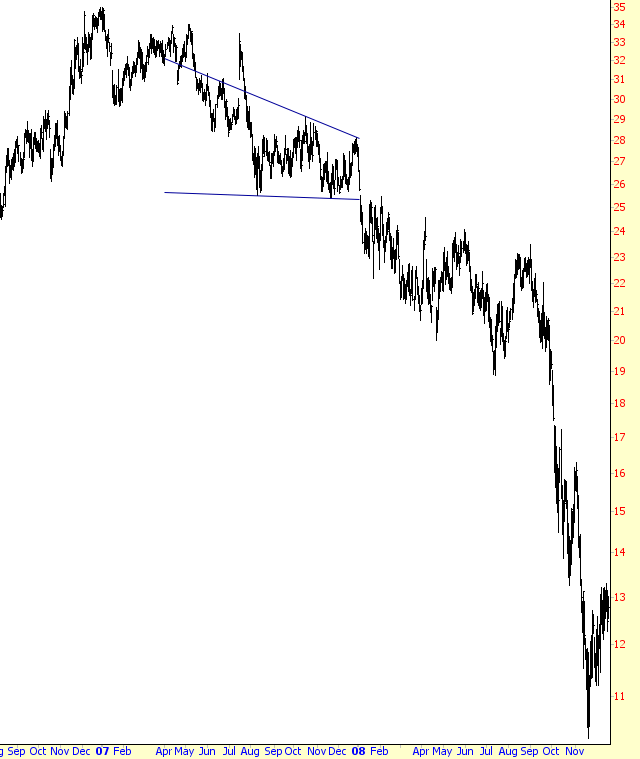
Pattern Start: 7/25/2007
Pattern Break: 1/4/2008
Break Price: $25
Lowest Price: $10
Percentage Change: -60%
Example: Genworth Financial
Sometimes a stock will break a pattern and not react immediately. This is rather unusual, because the entire logic behind a pattern’s violation is that support is broken (or resistance is overcome), and the stock moves swiftly in a given direction. As shown with symbol GNW broke its descending triangle, recovered, and then spent months meandering at about $23, plus or minus a few dimes. The projected direction of the pattern was fulfilled magnificently, but it took a few months for the movement to actually “kick in.” It seems that on occasion, as with prayers, delay doesn’t necessarily mean denial.
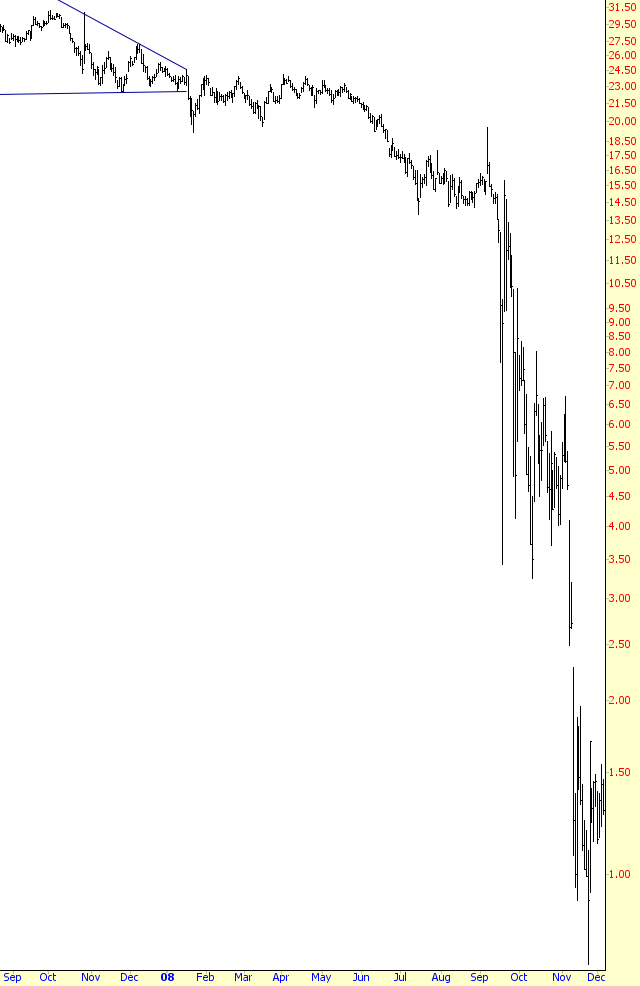
Pattern Start: 10/26/2007
Pattern Break: 1/17/2008
Break Price: $22.50
Lowest Price: $0.70
Percentage Change: -97%
Example: Ingersoll-Rand
Retracements may or may not happen after a pattern breakdown, but this example shows how a retracement provided an exceptional opportunity for more cautious traders, or latecomers, or those who wanted a second bite at the proverbial apple, to partake in a very profitable short-sale.
The descending triangle pattern was broken and then swiftly retracted to just below the horizontal line. The stock fell from about $43 to about $33, giving bears some excellent profits. Then the stock began a multi-month recover back to the lower 40s, recapturing for the second time the former support (now resistance) level.
The price fell again to just beneath the prior low, recovered somewhat again to approximately $40, and then began a swan-dive to beneath $12. This triangle pattern not only preceded an important drop in price, it preceded a whole series of profitable plunges, giving nimble bears three discrete opportunities to make money.
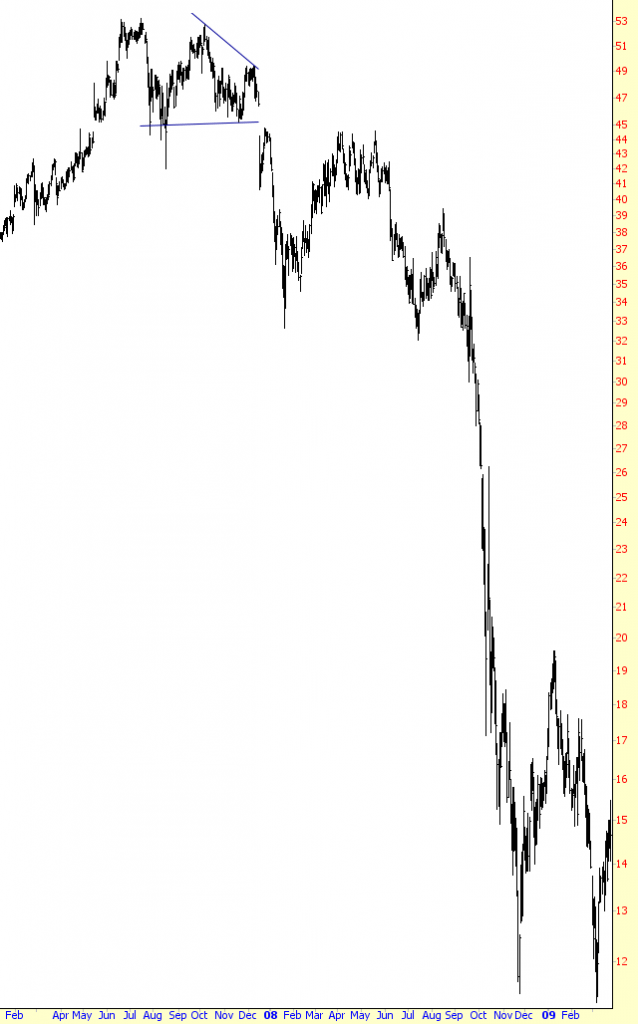
Pattern Start: 8/17/2007
Pattern Break: 12/17/2007
Break Price: $43
Lowest Price: $11.38
Percentage Change: -74%
Example: Syneron Medical
When a price falls, its descent can be more rapid and larger in absolute dollar terms than ascents from a pattern of similar strength. Because of this, more aggressive traders might want to take only part of their profits once a target price in reaching, leaving the rest in position for greater profits, protected by a stop-loss price that is updated on a regular basis.
A trader doing this in an instance like the one below would have been glad for it, since the target price of $10 was met and greatly exceeded. He might have covered half of his short position at the $10 target and then put in a rather liberal stop-loss order of $13 (still providing a profit, but also allowing for the chance of a further price drop). The risk, of course, is that the price pushes past the stop price and the profit isn’t as big as it might have been, but keep in mind a portion of the position was already closed at the target-price profit, and the remaining position is in place based on the possibility that further erosion may occur.
In this instance, it did, falling to beneath $5. Where you put your stop-loss price depends entirely on the chart, but sometimes simply setting the stop at the most recent “lower low” (in the case of short sales) is a crude but sensible method.
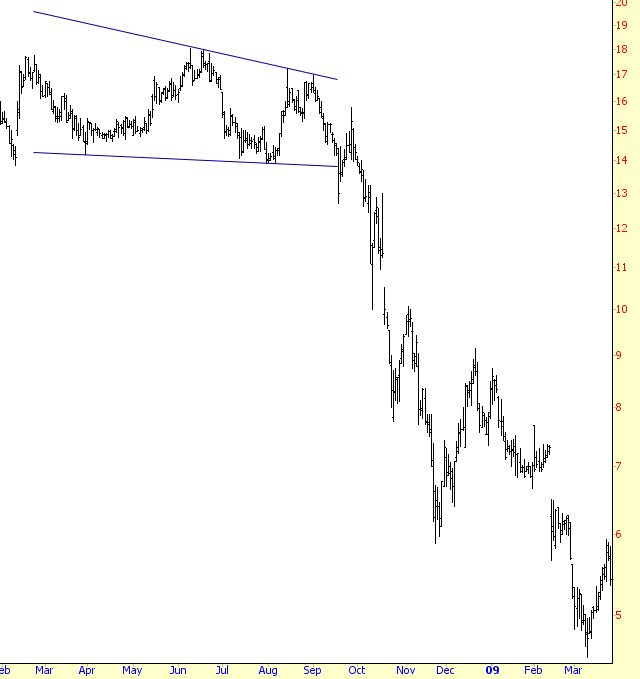
Pattern Start: 2/12/2008
Pattern Break: 9/18/2008
Break Price: $13.88
Lowest Price: $4.55
Percentage Change: -67%
Summary
One big difference between falling stocks and rising stocks is that the speed that they move. Stocks tend to fall much faster than they rise. Compare the examples in this section with the stocks in the Ascending Triangles section. The patterns are the same in construction (albeit upside-down from one another), but the amount of time it takes a stock to climb to its ultimate high is often several times longer than the examples provided here. Also, for stocks that have ascending rapidly in price in the past, the level s of support to slow down a plunging price may be few and far between.
