The cubic curve is so-named because, when graphed mathematically, the formula always involves a “cubed” value (like X-cubed plus X-squared, etc.) In simpler terms, this drawn object allows you to draw an arc with a kink in it, resulting in an S-shaped curve. Financial markets follow this kind of path more rarely than a simple arc (which would be created using the SlopeCharts quadratic curve object), but it is available to you nonetheless.
The icon for this tool is tinted here:
Here is an animation showing the creation of a cubic curve with its four anchor points. The first two points are the end points, whereas the third and fourth clicks designate the inflection points of the curve.

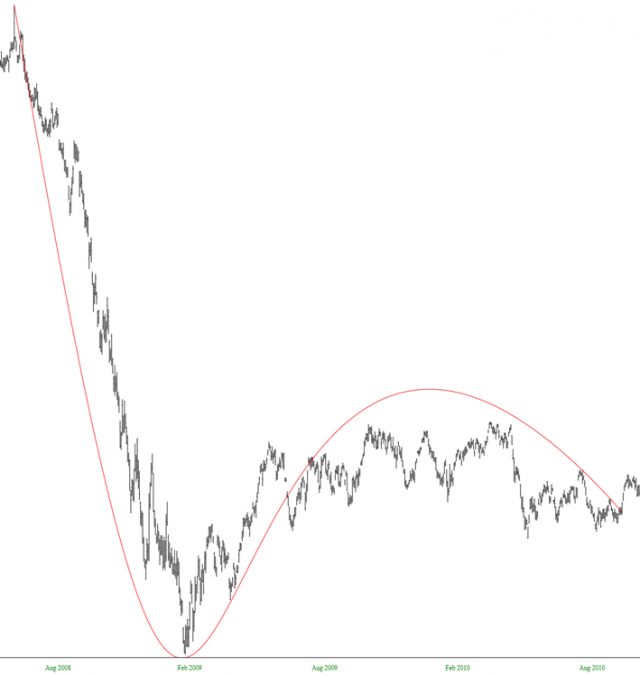
Here, for example, is the oil ETF (symbol USO) with a cubic curve laid on top. Its bullish breakout occurred once it pushed above the curve line, on the right, thus avoiding the market finishing a rounded topping pattern.