As a financial instrument moves up and down in price, it tends to move to one extreme and then revert to the mean. Some technical indicators and drawn objects can be helpful in trying to determine overbought and oversold conditions, and the linear regression line is one such tool. This tool also incorporates the Raff Regression Channel, which is the linear regression flanked by two parallel, equally-spaced lines.
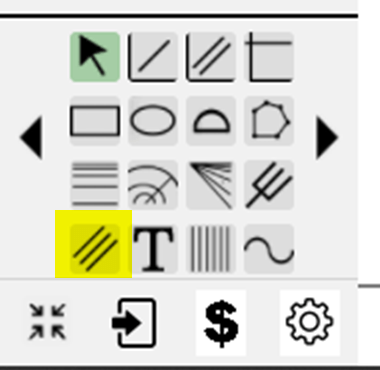
To use the tool, click the icon in the toolbox.
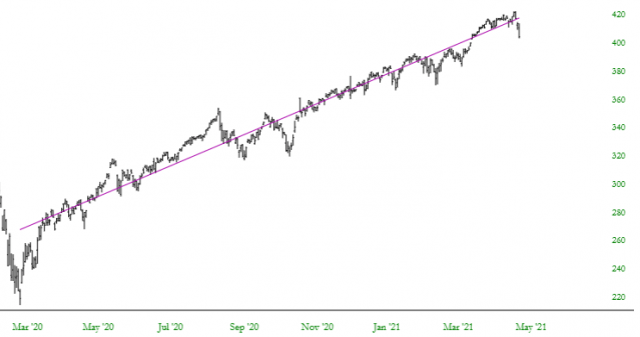
After the tool is selected, all you need to do is click at a starting point and ending point in the price change where you want the line drawn. Unlike other tools, there is no need to worry about where you are pointing on the price axis (that is, the y-axis) because the proper location will be automatically calculated for you. Just click at the starting point, drag the mouse, and then click at the ending point. The linear regression line will be drawn:
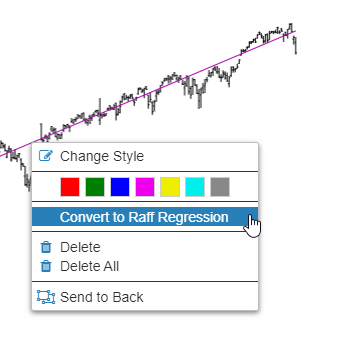
You can right-click on the line to change its color, delete it, send it behind other objects, or access the Change Style dialog box. Importantly, you can also click Convert to Raff Regression to change the linear regression to a Raff style.
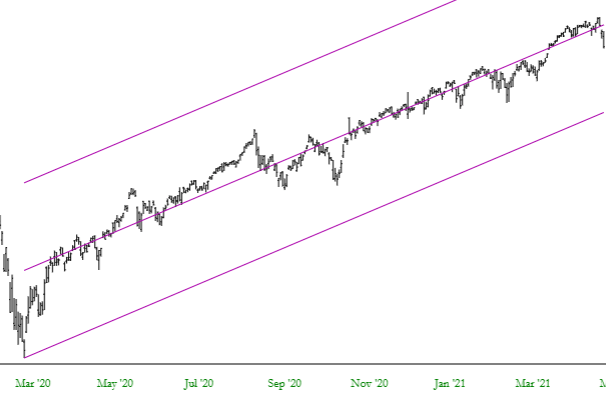
Here is the same chart, except using the Raff style of regression study. The lower line is anchored to the lowest point of the range, and the upper line is positioned the exact same distance from the middle line (which is the regression line).
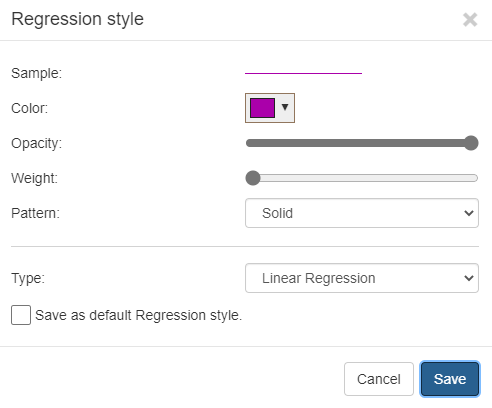
The Change Style dialog gives you more control over precisely the color to use, the opacity, the weight, the pattern, and also gives you the opportunity to preserve your settings as the default style for this particular drawn object.