Volatility is a term that is used frequently in financial markets and is one of the most important elements of options trading. The implied volatility (IV) varies from instrument to instrument, but for any one instrument, it’s the relative volatility that is of interest to us, described as IV Rank. (You can learn about normal volatility data here).
This short article will cover the basics of what you need to know about implied volatility and how to start using IV Rank to make more informed trading decisions.
The SlopeCharts Technical Analysis Platform has a feature that measures the implied volatility of a given financial instrument based upon its options pricing. This feature is available only to Platinum users. You can upgrade your membership to get immediate access to the IV Rank feature by clicking here.
Implied Volatility & IV Rank
Implied volatility is a forward-looking measure that investors use to assess the potential future price fluctuations of a security and reflects a market’s general sentiment on the underlying security. Implied volatility is a measure of how much the market expects the price of an option to move. The higher the implied volatility for a given asset, the riskier it is believed to be relative to other assets. The counterpart of implied volatility is historical volatility, which is a measure of how much an asset’s price actually moved in the past.
Implied volatility is represented as a percentage. In contrast, the IV Rank range is from 0 to 100. One extreme, 0, means that for this particular instrument, it is at the lowest level of volatility for the year. The other extreme, 100, means that the volatility is at its relative maximum (and thus, for you option sellers, is probably an appealing candidate since it has such a rich premium).
IV rank is used to identify a security’s implied volatility compared to its IV history. This is important because for one stock an implied volatility of 50% may seem high, but if it is GME, that would be considered low because at one point it touched an IV of 800%. In contrast, it may seem that a stock’s IV is low at 20%, but if it is a mature company that hardly moves 5% throughout a year, then it would be relatively high. These examples show why IV Rank is important, so that traders can understand the current implied volatility of a stock relative to its historical performance.
How To Understand IV Rank
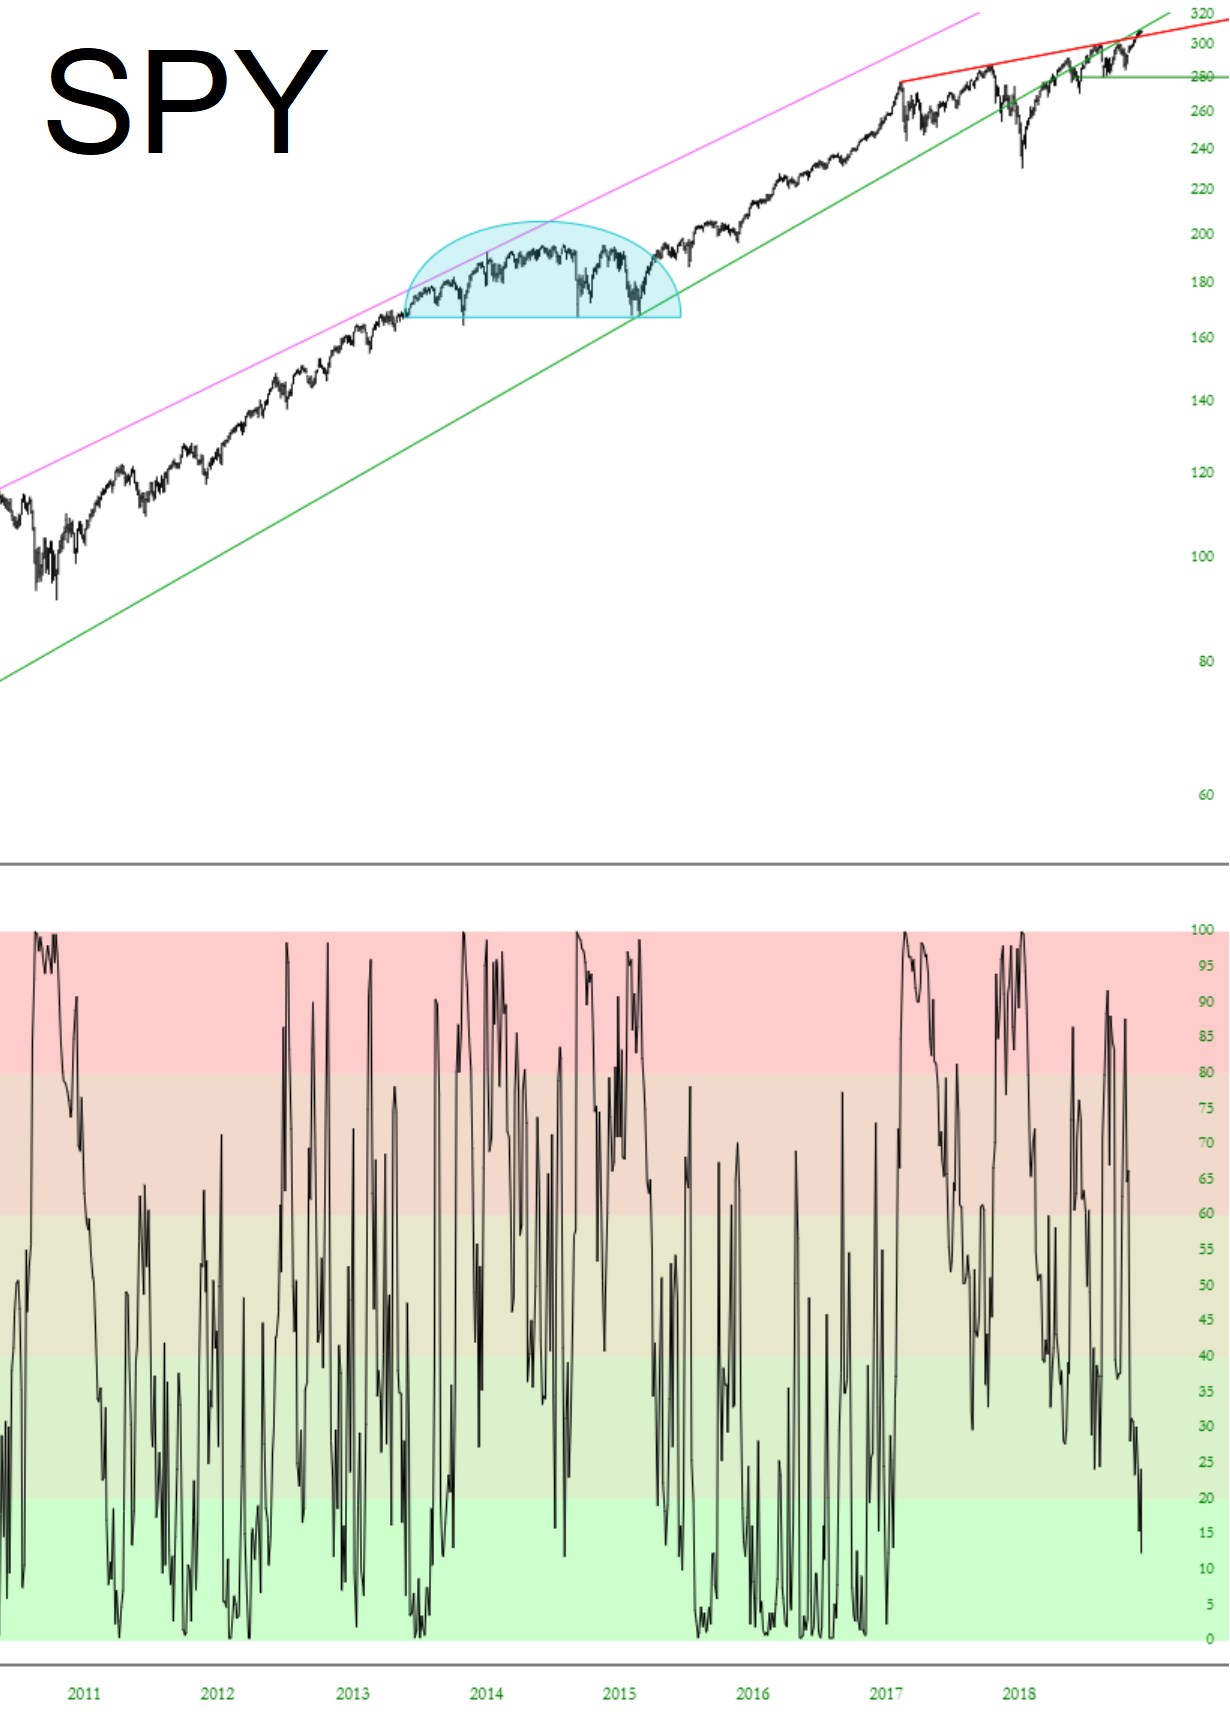
IV rank doesn’t affect option pricing, but the current implied volatility does affect option pricing. Implied volatility tends to go higher when a security goes lower, and vice versa. IV Rank, however, doesn’t have this simple reverse correlation. Instead, it tends to go to extremes when the underlying instrument goes to extremes. The example below illustrates this point, showing how the IV Rank (lower chart) spiked to its maximum 100 level at both a peak in price as well as at the lowest point for the S&P 500 index.
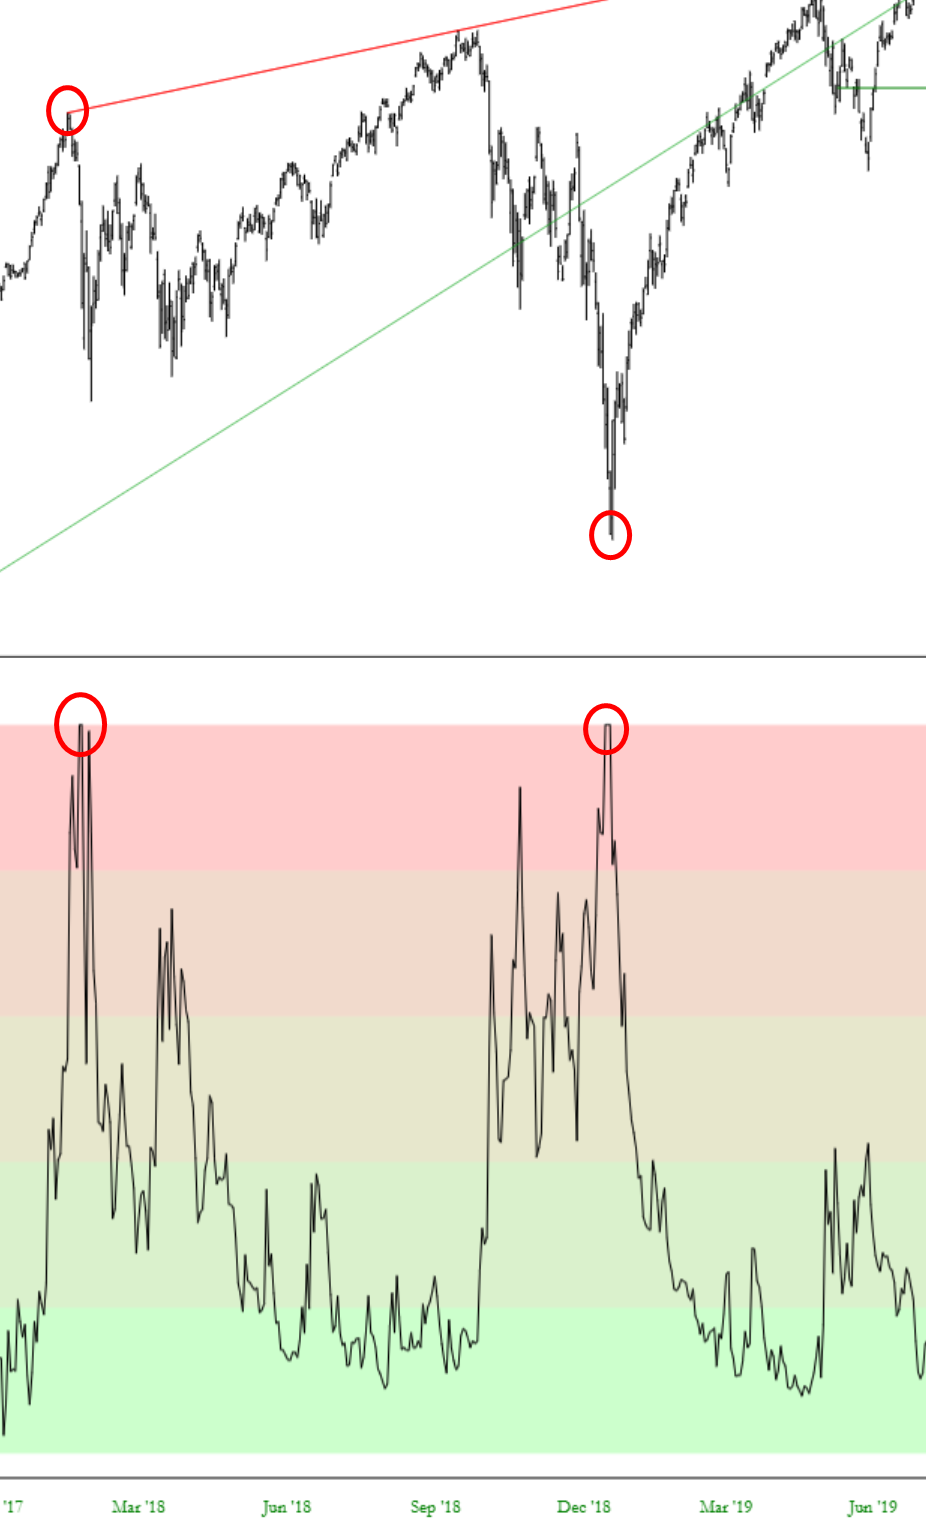
The lower image is the IV Rank graph itself, shown independently for the sake of detail. The chart is broken into five equal zones (0-20, 20-40, 40-60, 60-80, and 80-100). Notice how SlopeCharts tints the zones so you can get an immediate sense as to how “hot” or “cold” the volatility is running right now. It couldn’t be any simpler to interpret.
If a stock’s IV is very high or low relative to its IV history, then this is a piece of information that can be used to make a decision on the potential timing of an investment. If you’re selling an option, you generally would prefer to sell when IV is high, for higher premiums.
So, a high IV Rank is a potential indicator for a selling opportunity, while a low IV rank might be an indicator to buy if you are able to identify a directional trend for that security.
When considering IV Rank, it is vital to understand the duration of the volatility data that is being used. It is common to use data for the prior 30 days, when a security is currently highly volatile. On the other hand, using data for the full year provides a larger data set for the calculations. The yearly IV Rank, however, moves far more smoothly.
SlopeCharts Tool For Using IV Rank
To activate the IV Rank chart, just choose it from the Options menu.
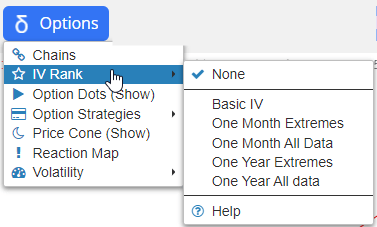
There are four kinds of IV Rank from which to choose, as well as “None”, the default, which will clear away any selection.
Two of them are calculated based on data for the prior 30 days, thus they tend to be much more volatile. The other two are calculated based on the data for the past year. Besides this, the calculations can be based on the extreme high and low prices for the period in question or, alternately, on the entirety of the data set.
There is also a fifth selection, “Basic IV”, which provides the raw volatility data if you want to examine it for the sake of comparison. You can experiment with the different versions of IV Rank to see which one you find most useful.
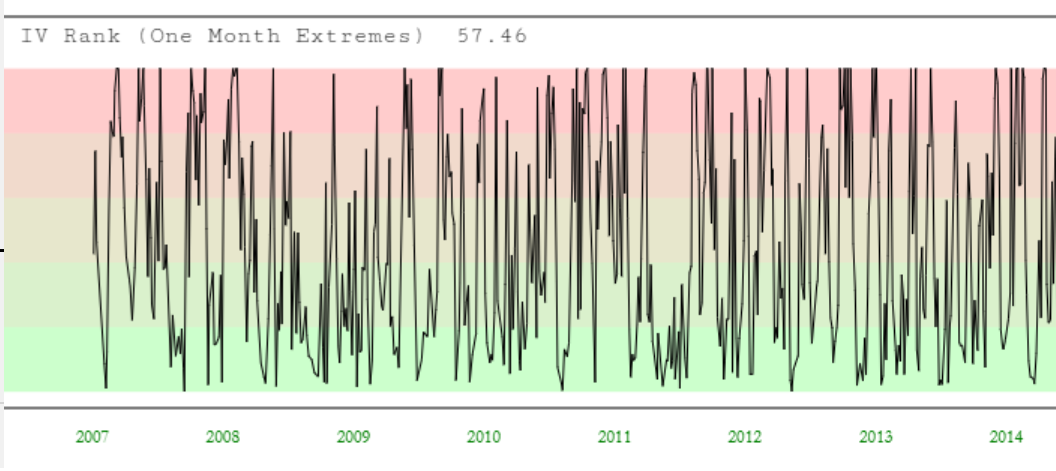
Here, for example, is the IV Rank based on ‘One Month Extreme’ uses the data’s extreme high and low levels. As you can see, this is a very kinetic graph.
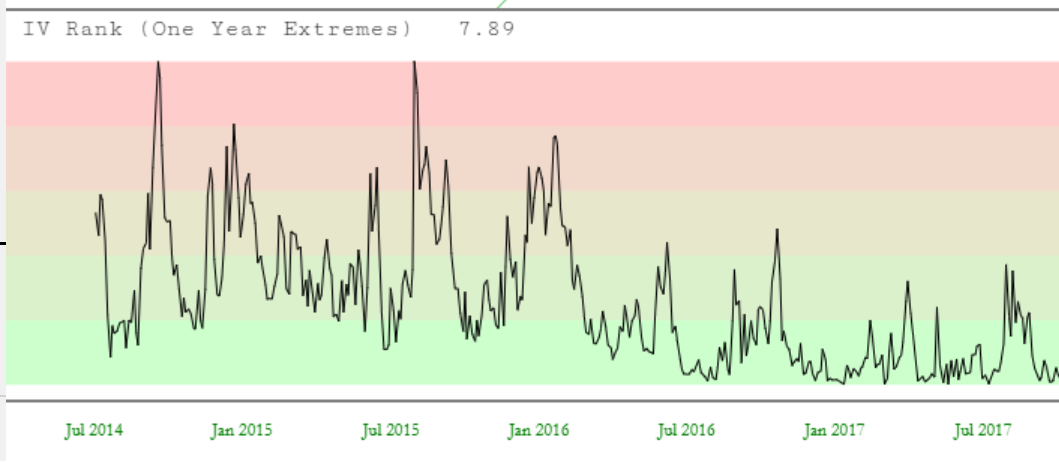
In contrast, the ‘One Year Extreme’ moves far more smoothly.
Below, for example, is the SPY with its IV Rank. The line chart is confined by these two extremes so you can see where volatility is, relatively speaking, for this instrument. As of this image capture, the volatility of SPY is extremely low.
Importantly, when you save a chart style, the presence of an IV Rank study is included. This is a great time-saver because it means once you have established the kinds of presentations you prefer, including IV Rank, they can all be incorporated in a single easy-to-click bundle without having to access the menu repeatedly.

