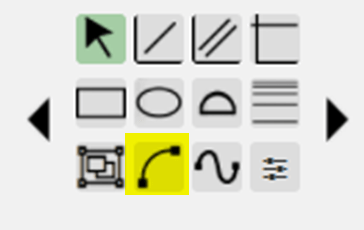
The quadratic curve is a sophisticated but very easy-to-use drawn object which connects to points via an arc whose shape you define. The icon for this is highlighted below (note that, as always, the icons available to you in this are controlled by you via the custom tool palette).
To use this object, as illustrated by the animation below:
(a) click on one point, which is your first anchor point;
(b) click on the second point, which is the second anchor;
(c) then drag the cursor to bend the line in any direction you like; once you are satisfied with the curvature, click the mouse a third time to finish the object.
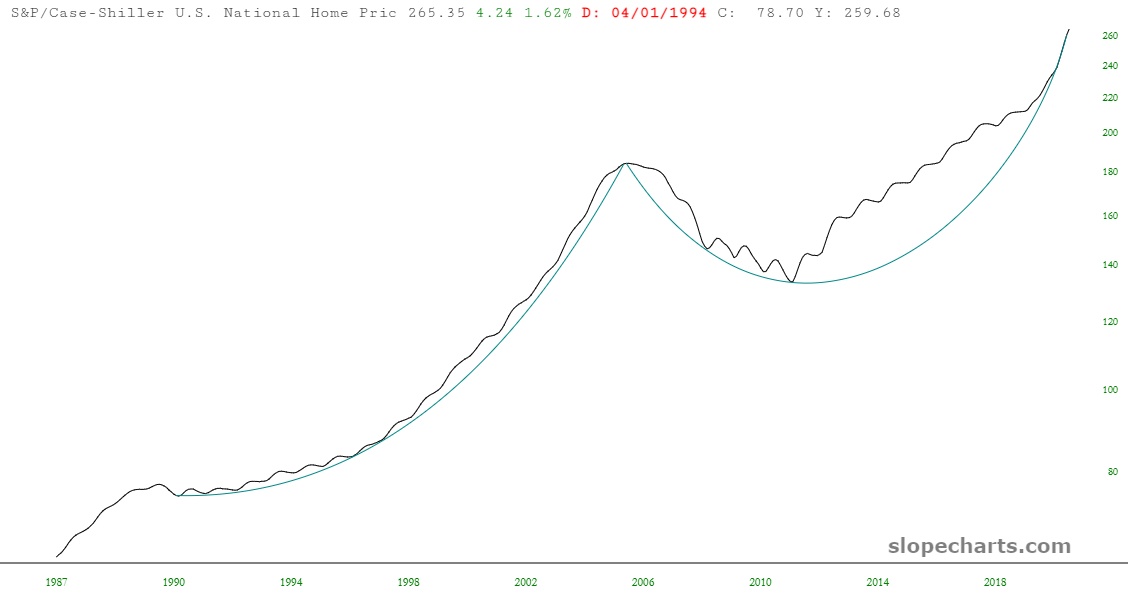
Below is an example of this drawn object used on an actual chart (in this instance, the Case-Shiller U.S. National Home Price chart). There are two quadratic curves used below. As you can see, this is a very appropriate use of the function, because the nature of the chart lends itself to these two smooth curves. This helps defined the “trend” of the price, suggesting support (or resistance) of the price action. A violation of the curve would be indicative of a trend change or at least a trend cessation.