To highlight an irregular area in SlopeCharts (one which isn’t cleanly represented by a rectangle or oval), you can use the polygon tool. Its icon looks like this:
When you choose it, you start by clicking on the first anchor point on the chart. Then move your mouse, click the second anchor point – – and then the third, the fourth, the fifth, or however many you want.
Once you are done, double-click your final anchor point, and it will connect it to the first. In other words, you don’t have to find your way back to the original anchor point. Just click the mouse twice, and voila:
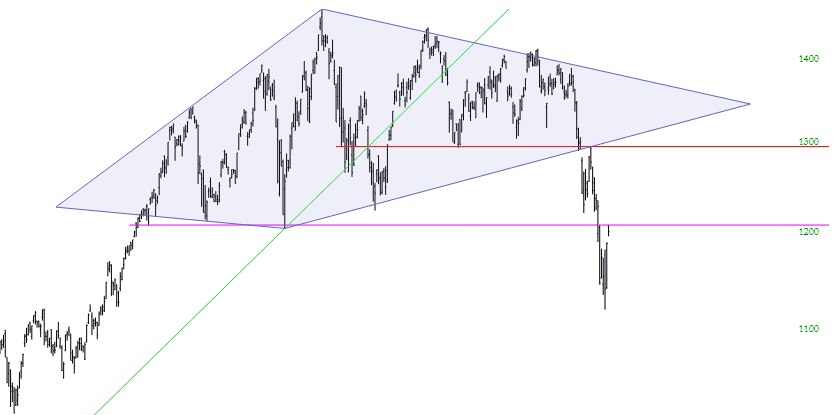
Here is a short, silent video to illustrate this feature, using the construction of a diamond pattern as an example.
