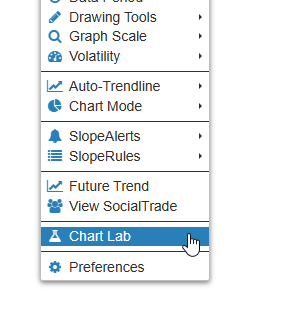
For Platinum members on the Slope of Hope, the Chart Lab feature lets you combine financial data in a way that isn’t possible anywhere else. Using a graphics “workbench”, you can arrange symbols, economic data, and mathematical operators to create your own unique financial instrument to give you insights into the financial markets and anticipated market direction. To access Chart Lab, you can select it with the right-click menu in SlopeCharts or by way of the Tools menu.
The Chart Lab dialog box is where you can construct your creation. There are “blocks” on the left side you can drag and drop into the workspace on the right, and the formula you create will be presented at the top. The interface is deliberately intuitive to make creating new formulae fun and easy.
The financial creations you make in Chart Lab can be simple………..

……or complicated, including nested blocks………..
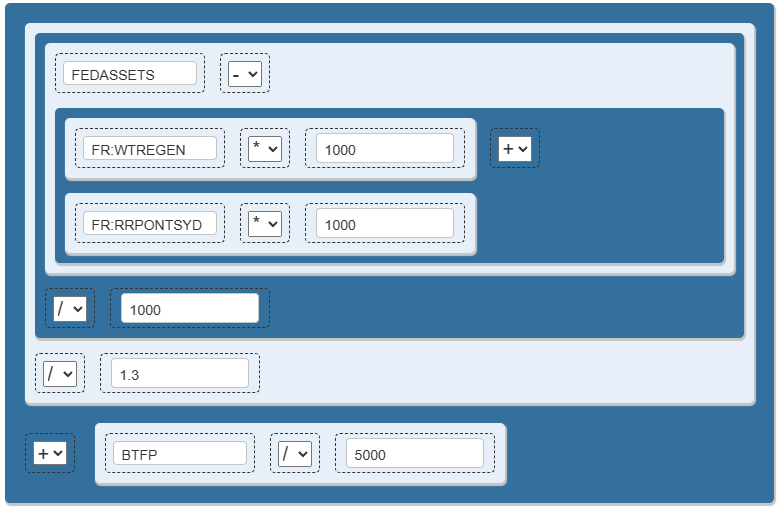
The objective with any of these is to be able to create a particular insight or perspective into the financial markets which are not possible with a standard examination of a single financial instrument.
Assembling the elements within Chart Lab is very simple (it is the creation of something very useful which is challenging, and that, of course, is up to you!) On the left side of the dialog box are five different kinds of blocks you can drag into the workspace. You can arrange these however you like, and you can move them about and alter the contents of the workspace to your liking.
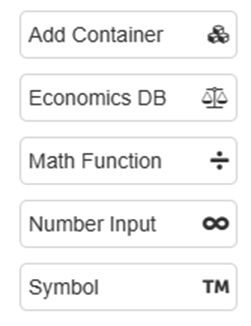
The functions of each of these five block types are as follows:
- Add Container – This allows you to “nest” items. For example, if you wanted to divide the symbol GLD by the sum of the symbols GDX and GDXJ, you would want to put the latter symbols (GDX, GDXJ) into a container of their own, since they are a specific subset of the entire formula. You can add containers within containers if your creation is especially complex.
- Economics DB – Here is a block which provides quick and easy access to our enormous economics database, and it is important enough to warrant its own tab on this instructional page.
- Math Function – This provides the ability to add, subtract, multiple, or divide, and it is the fundamental “glue” between each element of a formula.
- Number Input – Here is the simplest thing of all, because it allows you to enter a number (either negative or positive).
- Symbol – Finally, this block lets you enter any SlopeCharts symbol such as SPY, $INDU, NVDA, and so forth.
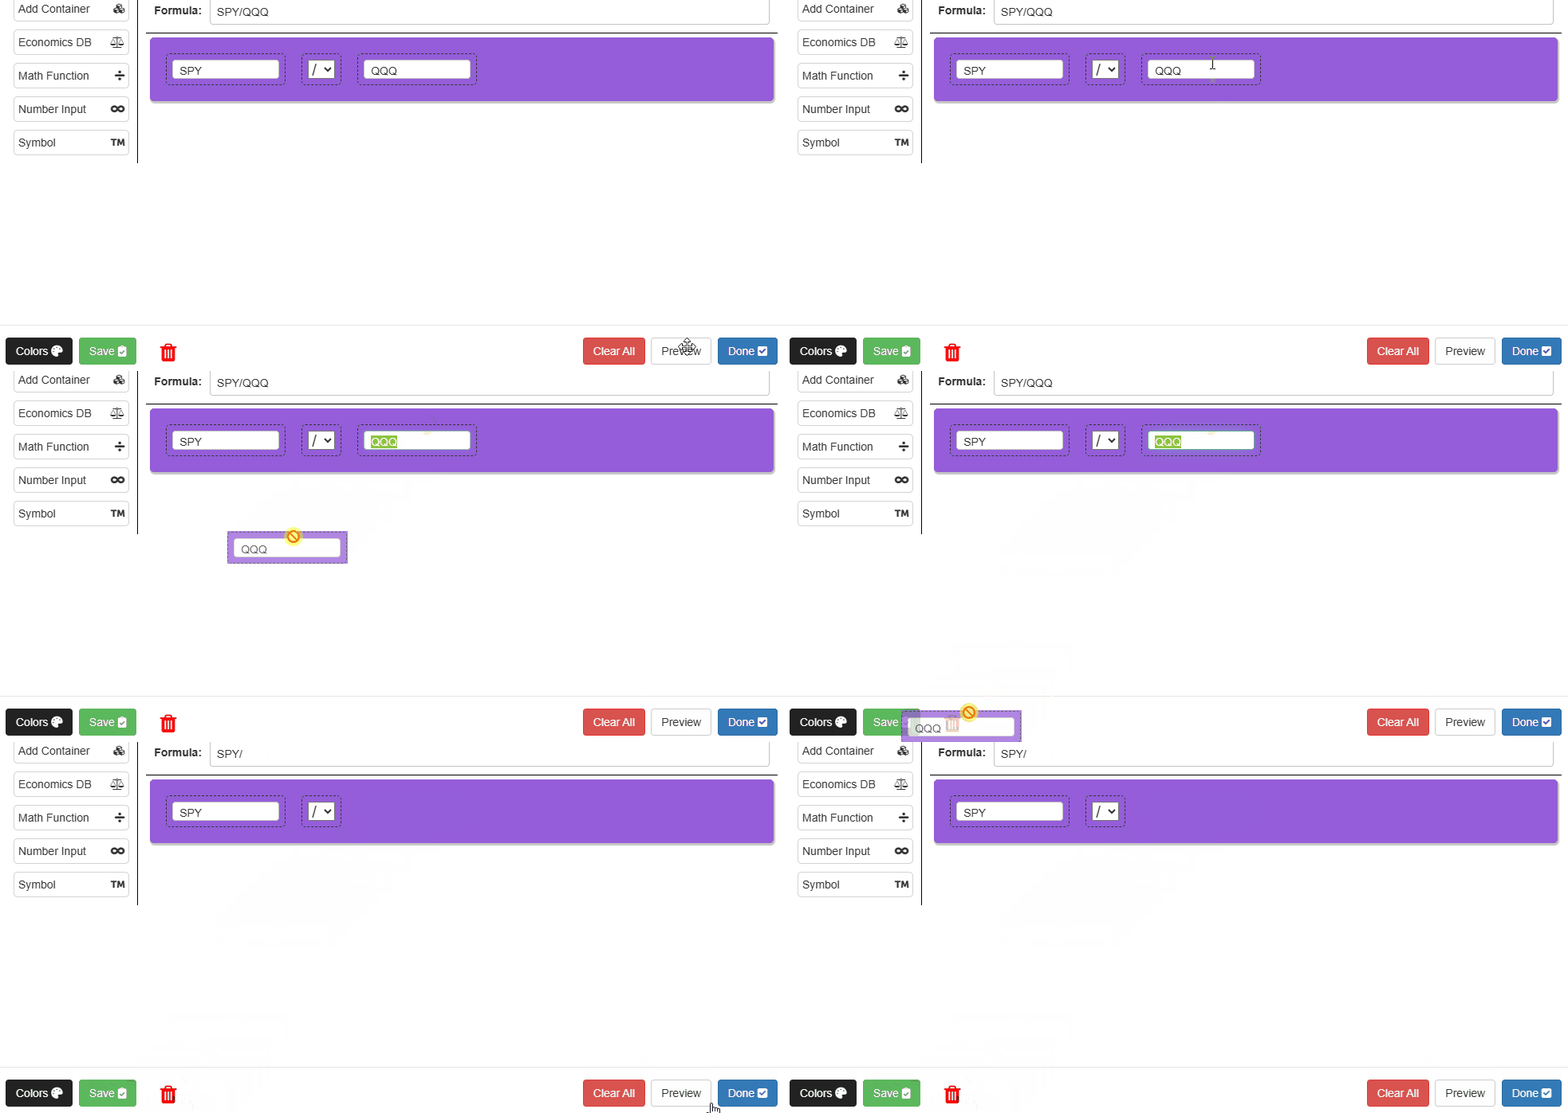
As stated already, assembling your formula is accomplished by dragging blocks from the left side of the dialog box into the large workspace, as illustrated here:
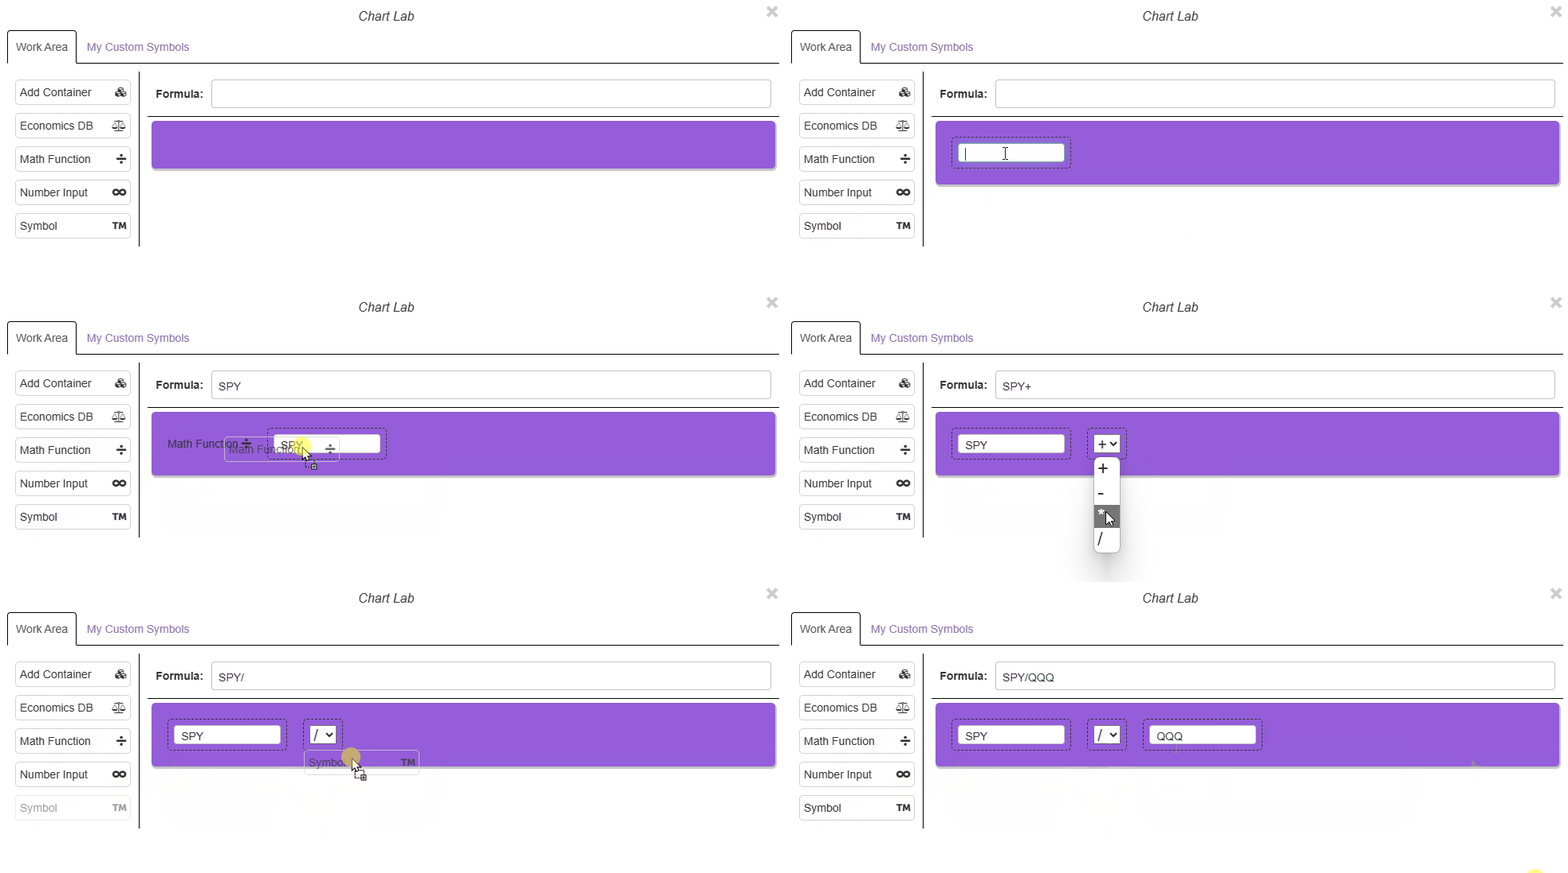
Once a block is in the workspace, you can move it and rearrange the blocks in any fashion. If you decide a block (or an entire container) needs to be deleted, just drag and drop it on top of the trash icon, and it will be removed.
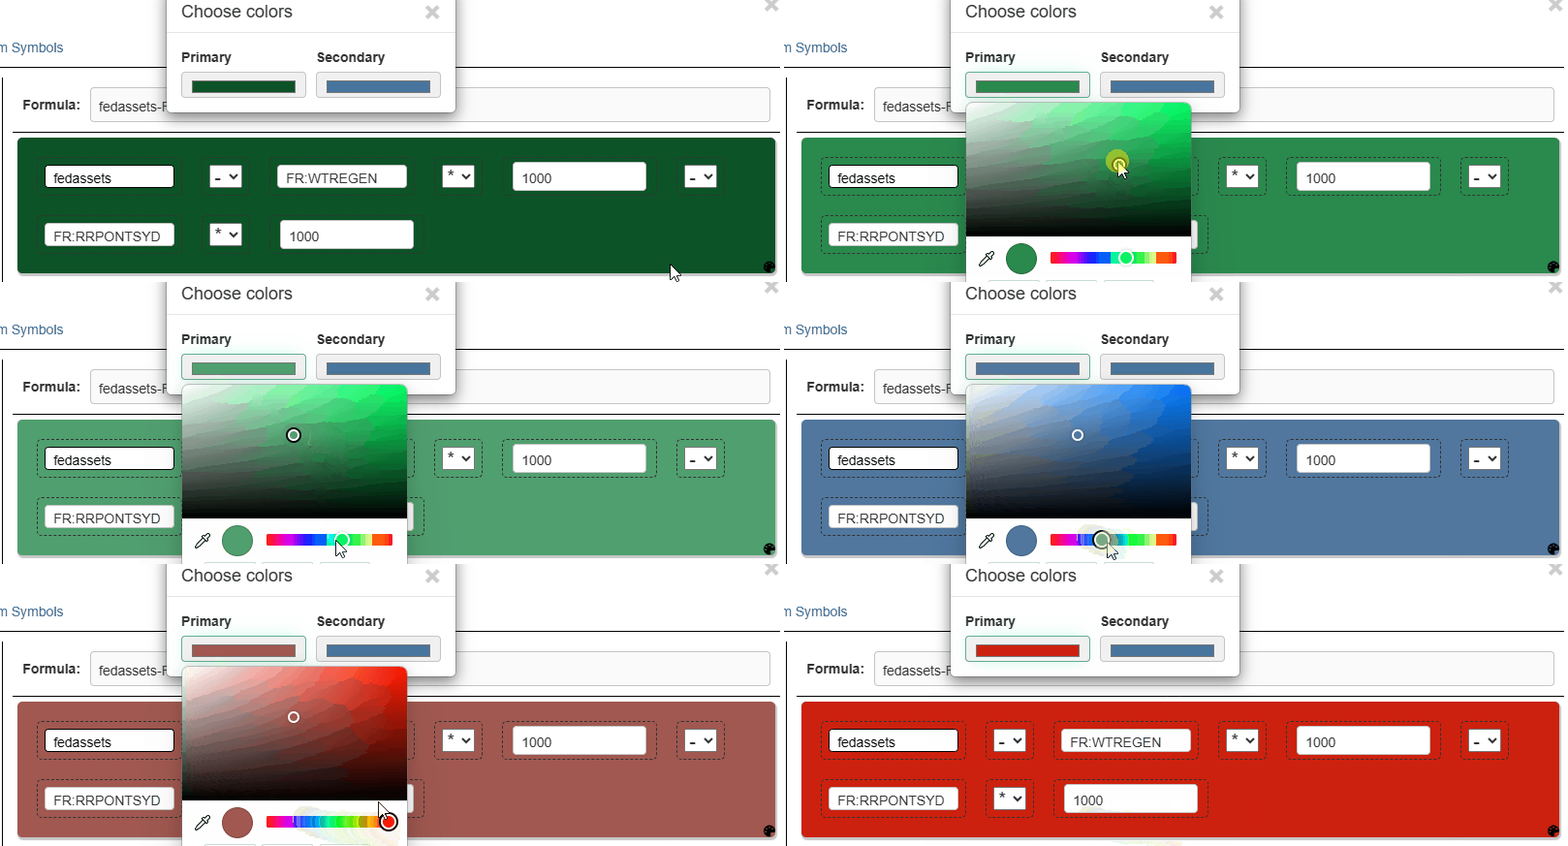
If you create more complex formulae, you might choose to change the colors so that the elements of the entire piece are easier to discern. Just click the Colors button to alter the color scheme to alter them and witness the change in real time.
One of the most time-saving features in Chart Lab is the presence of the Economics DB block, which gives you direct access to Slope’s incredibly deep database of long-term financial data from all over the world. The inclusion of this data block lets you integrate all kinds of time-series price data into your creations, including data that goes back literally hundreds of years.
Two of the big benefits that this data block provides is the ability to give it an alias (which makes the insane symbols much easier to understand) and the capability to search data sets within the Chart Lab work area.
To use the economics database block, point at it and drag it wherever you want in the workspace.

When you release the mouse button, a dialog box will appear with two tabs. The default tab, My Economic Elements, preserves the aliases you have created for different kinds of economic data (which, at first, will have no entries). The second tab, Custom Search, lets you type in words as the basis for searching for a particular kind of data.

When you are new to Chart Lab, you will not have any of your own economic elements created, so you will want to create some by way of searching for data. The do a search, just type the words you want to seek. It is usually best to keep the search string as simple as possible.

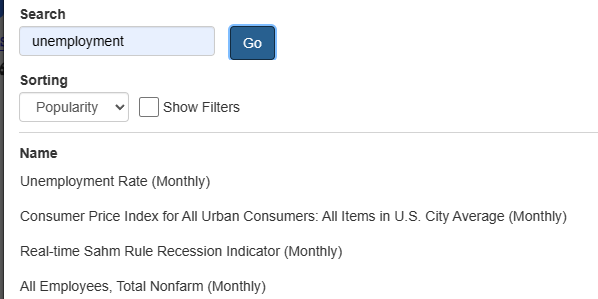
Based on this example, searching the word “unemployment“, a long list of possibilities will be presented, with the most likely choices at the top. There are many ways to filter and fine-tune your search, but those are covered thoroughly on a separate page here on Slope. When you see the item you would like to use from the list, click on it.
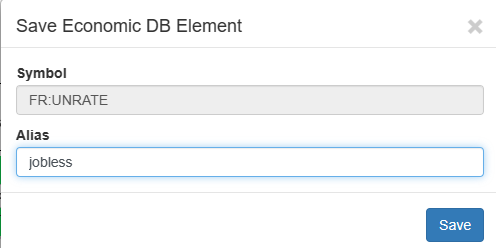
After you click on a choice, a new dialog box will appear with the symbol already in the Symbol field. In the Alias field you can, if you choose to do so, enter a “nickname” for the data so that it is easier for you to know what you are looking at. In this instance, the user would like the information in the block to be labeled “jobless” as opposed to the confusing FR:UNRATE symbol. (It should be noted that FR:UNRATE is probably one of the easiest and clearest symbols in the database, so we encourage you to make use of the “alias” feature in Chart Lab.)
As you create these aliases, they will be retained in the My Economic Elements tab for later use. To do so, you would click the Use button. You can also permanently remove the entry by clicking Delete. You are welcome to use any combination of uppercase and lowercase letters. The goal is to make your alias clear and obvious to you with respect to the purpose of that particular data element in your formula.
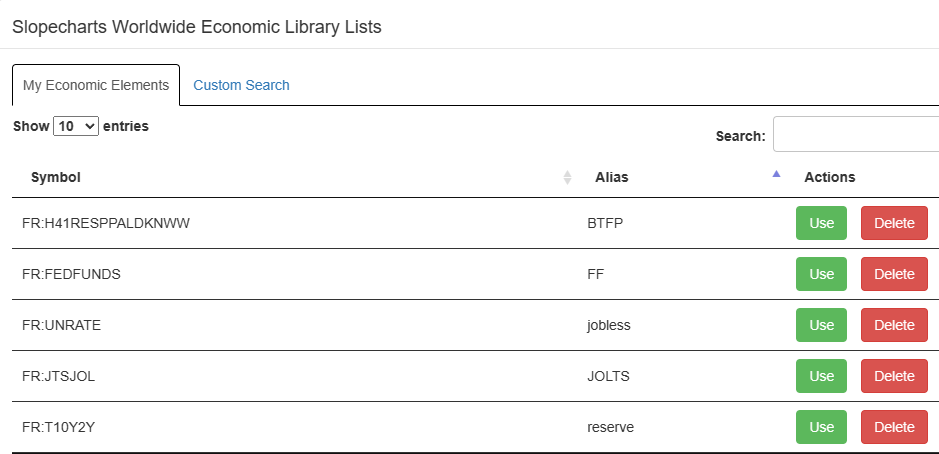
Once you have finished choosing the data element, it will appear in a block, just like a normal symbol. The key difference is that, unlike the Symbol block, you cannot freely type inside an Economics block. Instead, it acts like a button, so if you click on it, the system will let you change either the data being used or the alias. In the example below, a Symbol block (with the common symbol “SPY“) is being divided by the consumer price index, which here has been given the alias “CPI“.

Naturally, after you work hard to create an exceptionally good, customized symbol, you will want to preserve it for later use, reference, and modification. To do this, click either the Save button or, if you are modifying an existing symbol, the Save As button.

In either case, the system will ask you what personal symbol you want to give it. What “personal symbol” means is the symbol you can use in SlopeCharts (preceded by two dollar signs, which means it is a personal symbol as opposed to something publicly used like IBM or SPY). For example, with the personal symbol below called FEDSPREAD, the user could access the chart in SlopeCharts by typing $$FEDSPREAD

It is also a good idea to provide a description of the thing you have created, just so you can remind yourself of its basis and utility.
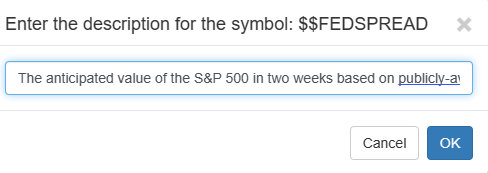
As you build out your personal library of customized creations, they will be presented to you so you can either Load them (into Chart Lab) or Delete them.

You may find it valuable to explore some of the customized personal symbols that other users on Slope have created. You can do this by clicking the Shared Symbols tab, which lets you explore everyone else’s symbols. You can sort this information by clicking at the top of any of the columns. If you see symbol you would like to use, click the Load button and its contents will be loaded into your workspace.
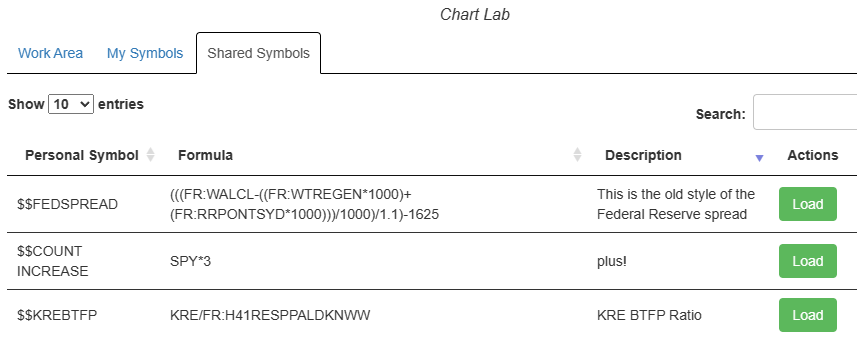
Please note that these symbols were created by other users and are in no way guaranteed to be useful or even functional. It is possible to make a “junk” symbol that doesn’t even do anything. However, you may find some gems, or there may be instances when you want to load something which exists and then modify it to your liking. If you do find something you like (either in its original form or after you have modified it yourself), you can use the save Save As button to preseve that creation as your very own.
