View: ES Quantitative Analysis | Slope of Hope
ES Quantitative Analysis | Slope of Hope
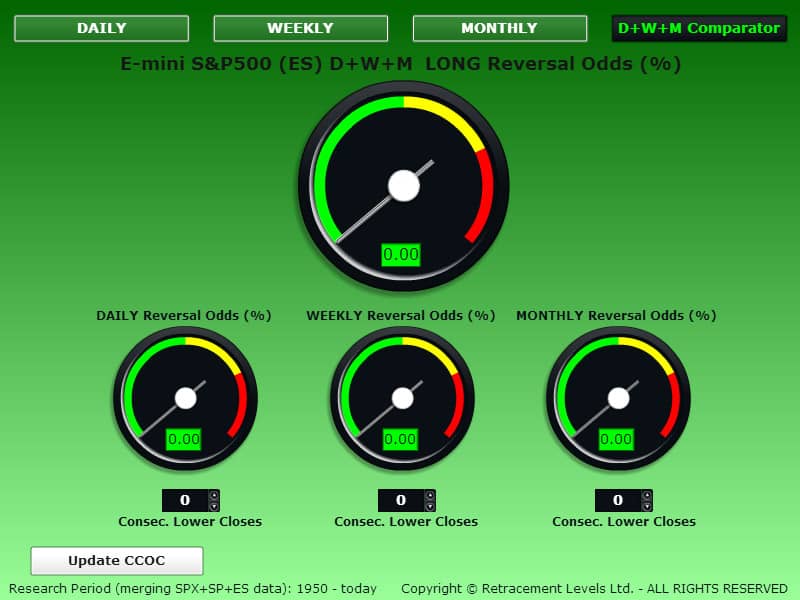
Note: when a gauge shows 0% daily odds it means the price is already moving in that direction. We gauge the ODDS to have a TREND REVERSAL, so if the market is going up the odds to have a LONG trend reversal are ZERO% because it is already an uptrend. On the other hand, if the market was going down, then we will have x% odds of having a LONG trend reversal at specific price levels.
TO GO LONG ANALYSIS
The CCOC DAILY gauge below is showing 0% odds to GO LONG.
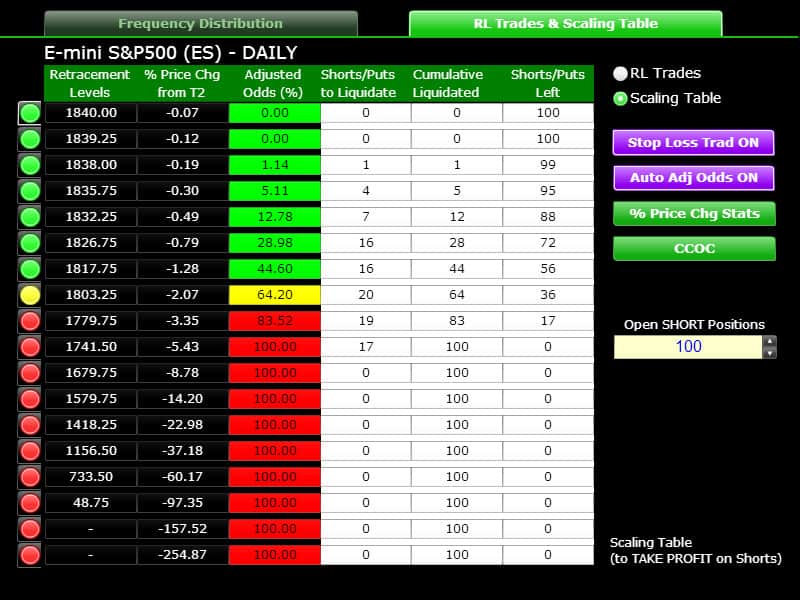
On the LONG Odds Table below we have the following relevant levels:
1741.50, 100% odds – Stop Loss level.
1826.75, 28.98% odds - First valid level to go LONG for the next trading session.
1817.75, 44.60% odds – First “safe” level to go LONG for the next trading session.
Yesterday the uptrend continued.
Not much to add at the moment on the LONG side, futures are down at the Open, but LONG levels with good odds to start a LONG reversal have not been reached yet.
The ES LONG Odds Comparator below tells us what the odds to go LONG would be if the 1826-1823 price area would be reached: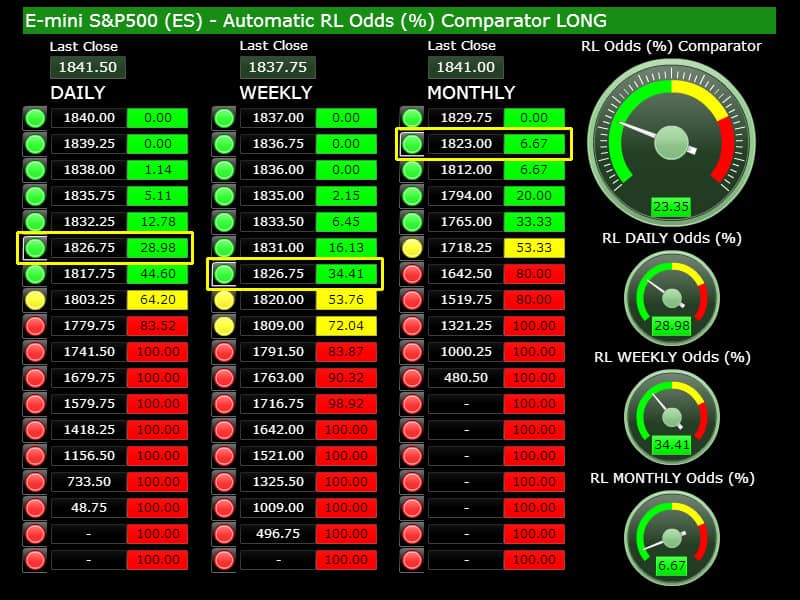
The overall odds (23.35%) aren’t particularly good for this trade, this trade will work if the market continues its upward march, i.e. in a buy-the-dips context – but it has to be seen if the ES can reach 1826 today.
TO GO SHORT ANALYSIS
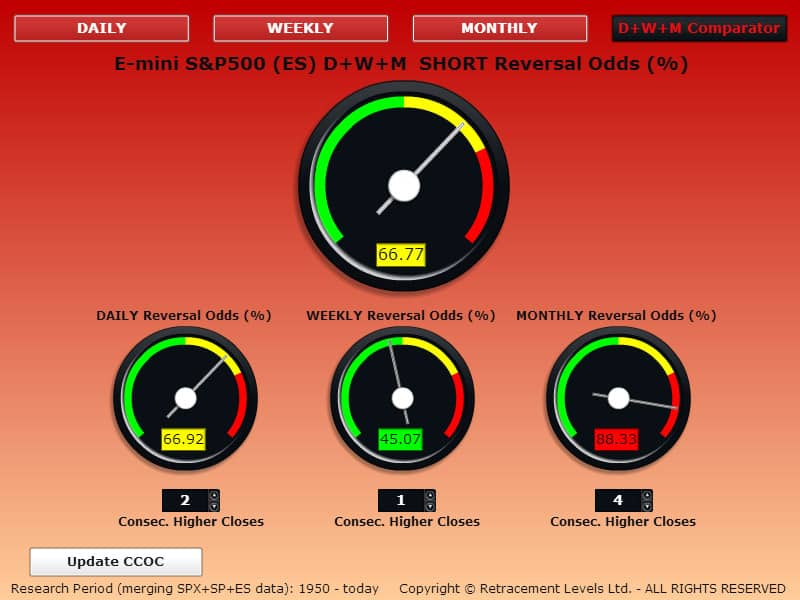
The CCOC DAILY gauge below is showing good odds to GO SHORT.
On the SHORT Odds Table below we have the following relevant levels:
1901, 100% odds – Stop Loss level.
1848, 68.21% odds – First “safe” level to go SHORT.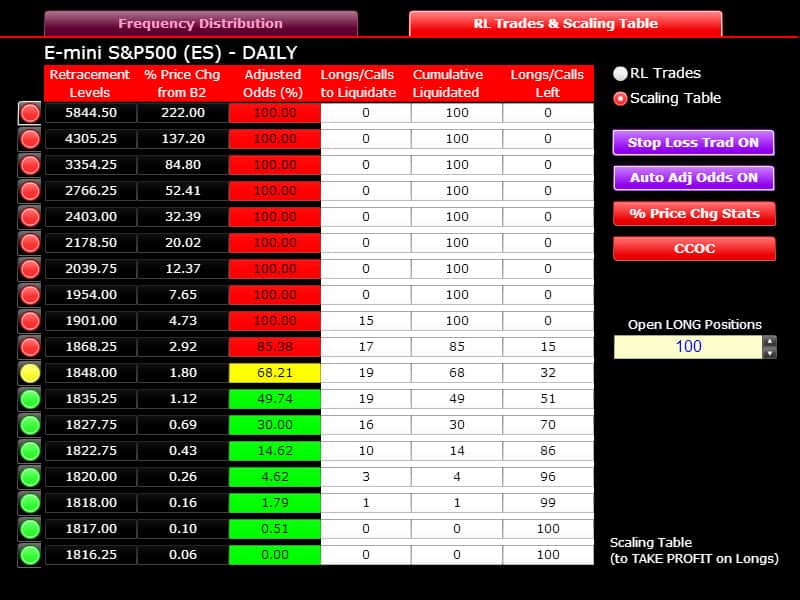
The 1848 level has not been reached yet, if the index gets there you can go SHORT without hesitation.
The ES SHORT Odds Comparator below tells us what the odds to go SHORT would be if the price area near 1848 is reached:
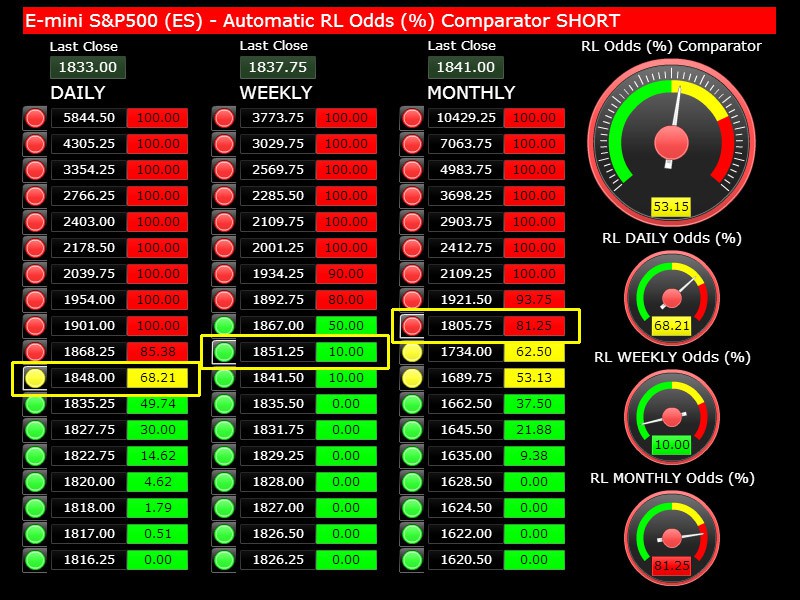
The Daily odds would be good (68.21%) and the Monthly as well (especially because the ES would be above the last Monthly Close @ 1841 and that reinforces the SHORT setup from the TIME perspective: 5 months up in a row).
What remains weak is the Weekly perspective, only 10% odds, but again, this may simply be because the correction started first on the Weekly as the indexes closed down 2 weeks ago and so the SHORT levels were re-set, and it will take a larger impulse to reach good Weekly odds.
In simple words: the Weekly is anticipating what may happen soon on the Monthly, it started to show some instability (up and down closes versus just up closes).
Copyright © 2014 Retracement Levels. All Rights Reserved
Comments
 Hokie
Hokie
