View: QQQ 2hour 5.10.14sc.png
QQQ 2hour 5.10.14sc.png
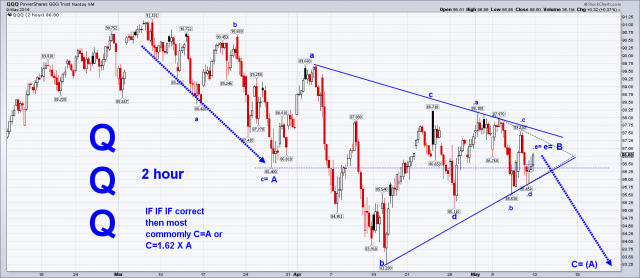
QQQ 2hour. I’ve noticed that the price action of QQQ is a series of a-b-c zigzags. One possible pattern is given below. B waves are often triangles and a contracting triangle appears to be forming. Sometimes the fifth wave of a contracting triangle (labeled “e”) itself becomes a smaller 5 wave sequence (labeled “.a,.b,.c.,.d,.e”. Since price was falling into the triangle it usually is falling coming out of the triangle. IFFFFFFFFFFFFFFFFF this turns out to be correct then the projected targets for C would either C=A or C=1.6 x A. Take care. Happy Mother’s Day to any Sloper Moms. Tom B
Comments
 Billy Ray
