View: sc-4.png
sc-4.png
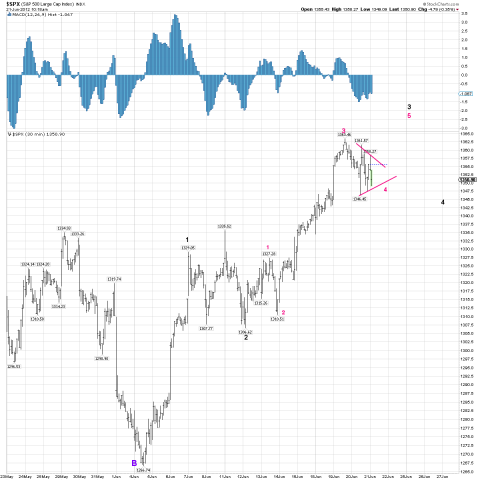
Looks like we are going to get a thrust out of the triangle to a higher high. Once that high is in, we will have 3 complete waves of the bottom (Black 1 - Black 3). IF this is rally is a new impulse wave taking us to new recovery highs (as my long term count suggests), than the correction that follows will merely be a Wave 4, and we will retest the 1346 area before Wave 5 occurs, which would confirm that the trend was up. If this is just a corrective rally, than the bearish trend should resume after the Black 3 completes itself (instead of Black 1 through 3 it would be labeled Black A through Black C under this scenario), and take us below 1266. Hence, how the market handles the correction FOLLOWING the thrust out of the triangle (which should happen regardless) will be very telling. ALSO, by the guideline of alternation, because black 2 was a FLAT (3 waves: 3-3-5; a sideways correction), than black 2 will be a sharp correction, so a zigzag/complex zigzag.
 PatrickRafferty


