View: slopechart_$ETH.jpg
slopechart_$ETH.jpg
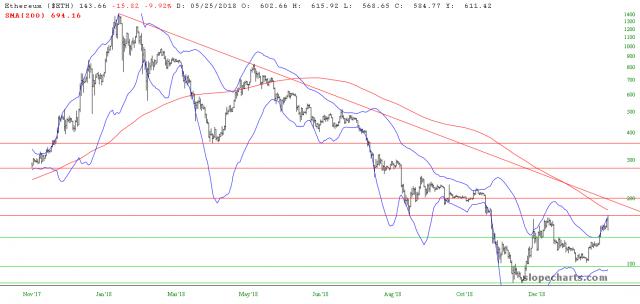
ETH has been pushing the upper Bollinger Band hard as it approached resistance where price was rejected. The chart clearly shows what has happened in the past when it moved up with such strength. It'll be interesting to see how it does with a confluence of resistance just overhead. Retaking the 200 day would be significant.
Comments
No comments yet.