Log In
|
Create Account
Chart
AI Chart Analysis
Chart Lab
Drawn Objects ➟
Earnings Reactions
Guide to Patterns ➟
Modes ➟
Power Features ➟
Rotation Graphs
SlopeCharts
Yield Curve
Equities
Biggest Stocks
Calendar of Earnings
Correlations
Earnings ➟
Historical Earnings
Market Capitalization
Power Screener
Super Summary
Volume/Price Leaders
Woulda Shoulda
Markets
CryptoStream LIVE
Economic Database
Global Economics
Heatmap
Macroeconomics
Market Meter
MetaSymbols
Quad Matrix
SlopeRules
Watch Lists
Options
Analytics ➟
Backtest Strategies
Earnings Calendar
Extreme Options
Historical Charts
Matrix of Volatility
Open Interest & Volume
Payoff Analyzer
Strategy Explorer
Volatility Calendar
Read
Automatic Reports
Best Posts of All Time
Books by Tim Knight
Guide to Comments
Latest Posts
Mobile Apps
Profile of Your Host
Recommended Books
Ticker Stripper
Trading Rules
Social
Browse Chart Database
Comments Search
Hall of Fame
Members Directory
Publishing/Subscribing
Recent Activity
Search SlopeRules
Shared Labels & Lists
SlopeTalk LIVE
Trader’s Diary
Help
Best Pages for You
Charts Overview
Guide to the Site
Membership Levels
Pattern Video Library
Power Screener Guide
Premium Memberships
SlopeCharts Reference
SlopeCharts Videos
Video Tutorial
Log In
Create Free Account
Memberships
View: esH2log
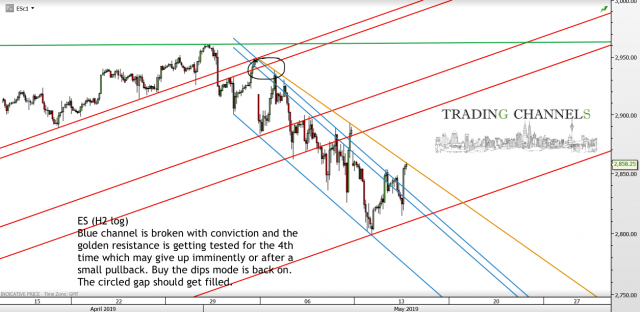
esH2log
ES (SP500)
Image added from
tradingchannels.uk/chart-of-the-day/
Comments
Gonnabesick
Was just going to say, if they can't keep it below 2900, yes we test ATH, and likely go to 3062 or 3124 next. They're gonna milk this rally for all it's worth.
Will be ironic if
INDU
tops at 38957 (and SPX 3895?) like the Nikkei before it.
5/15/19
Burak
I don't think it will get to way above 3000, if at all but 2950 is very probable now.
5/15/19
...
Actions
Tweet
Facebook
Stacks
S&P
Posted
By:
Burak
On:
5/15/19 2:37PM
Statistics
Viewed by 19 SocialTraders
No ratings yet


Will be ironic if INDU tops at 38957 (and SPX 3895?) like the Nikkei before it. 5/15/19