
Thanks for the input.
Also I don't think I have ever had to try and slap channels or anything else on a legitimate bear market...
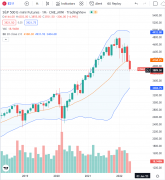
View: slopechart_/ES.jpg
slopechart_/ES.jpg
On topic with the retracement theme...
Ooops: Part 1
I like charts. That doesn't mean mine are worth a dookie. Self-taught. Well, I have found a few mentors along the way via the internet.
This is a shared fuck up, mostly so I remember but maybe somebody else can skip a step.
I drew this channel on a few indices back in early April after it appeared our little counter trend rally had expired. A channel which appears to have been broken to the downside.
Log scale/daily for reference. Linear does put today's close right at the underside of said channel, but I don't regard that as a huge difference. You can try that little experiment on your own at any rate...
Comments


Measured move targets are mostly channel-width moves, which is why I only use the 0 - .5 - 1 (or 0 - 1 - 2) measures anymore. I don't bother with other fibs. Trying to keep it simple...
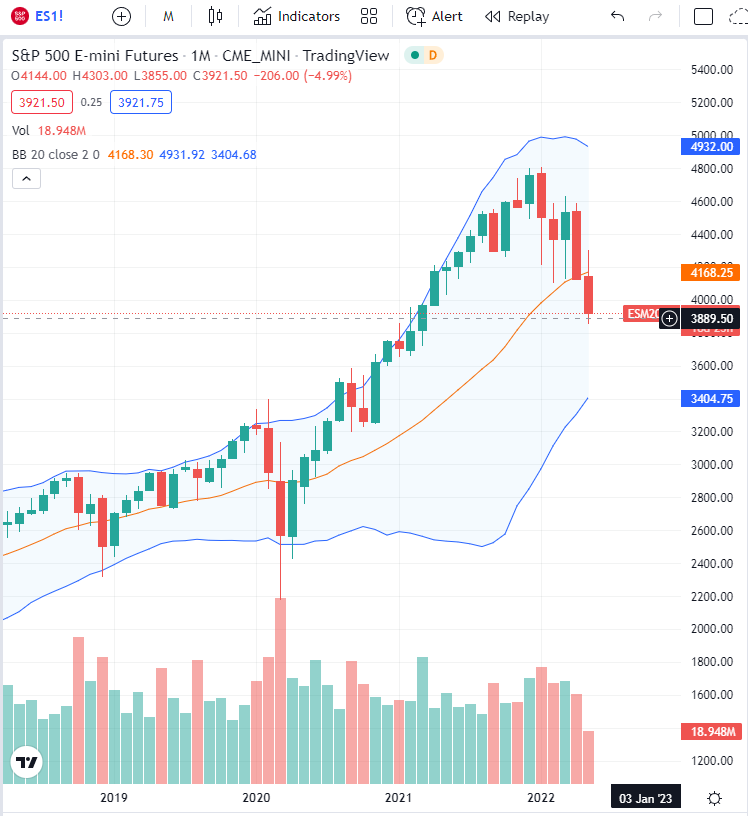
Notice where Half Way Back from the 2020 low is on this Weekly chart. Also, I should have noted the Jan 2018 to Mar 2020 range (shown here).
And note, too, the Monthly lower-BB level vis the other target levels/ranges from above.

Notice where Half Way Back from the 2020 low is on this Weekly chart. Also, I should have noted the Jan 2018 to Mar 2020 range (shown here).
And note, too, the Monthly lower-BB level vis the other target levels/ranges from above.
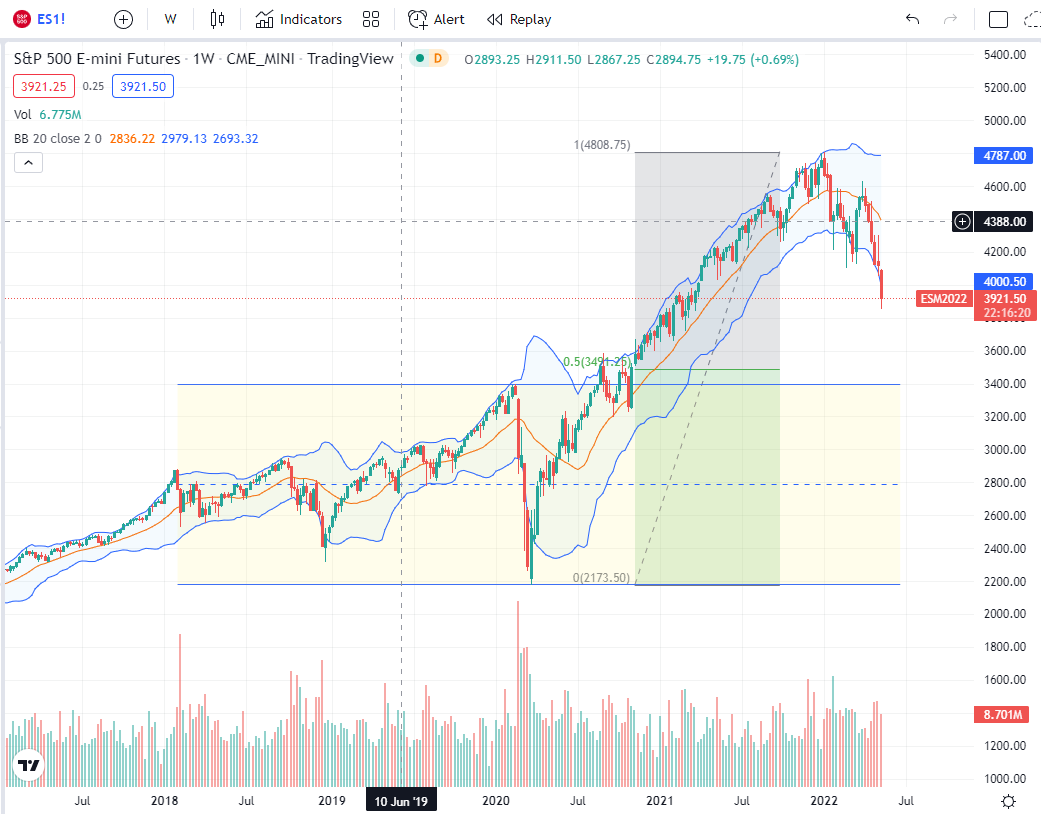

Note, too, that trending moves often reach to the next trading range (marked hoizontal.) Of course, there's the really big one from the year 2000 top to the year 2009 bottom (not shown.)