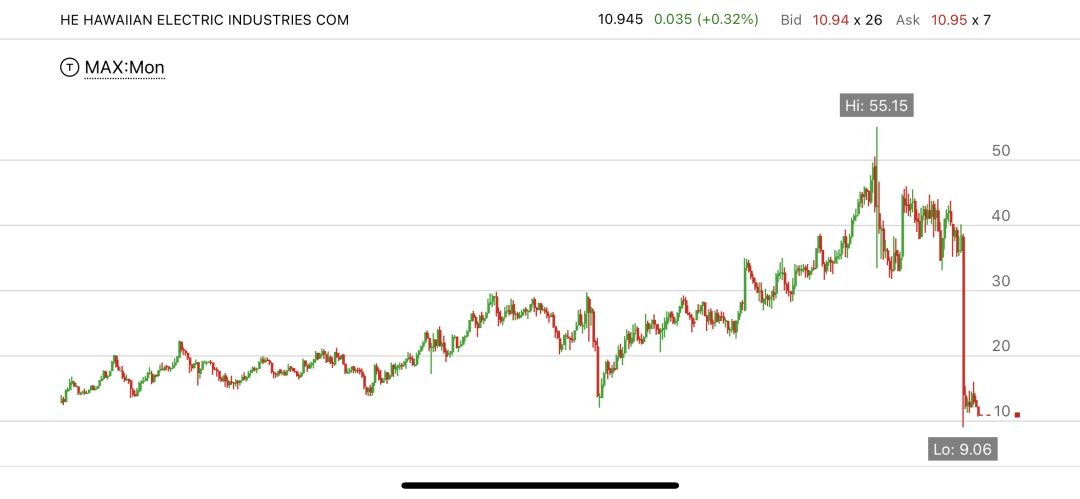
View: slopechart_HE.jpg

slopechart_HE.jpg

Am I interpreting this correctly as a Bullish Falling Wedge? I know HE has some legalities to sort out but does this look like a solid wedge? I'm no pro so comments are welcome. Thank you!

Image added via SlopeCharts
slopechart_HE.jpg

Comments

GonnabesickGonnabesick
Mebbe…. but mind your context: 
3/19/24
Mr. WizardMr. Wizard
@YummyTrade  
It's a falling wedge, but not a very good one. Ideally you want price to clearly bang back and forth between the upper and lower trendlines, with progressively smaller moves as the downward momentum exhausts itself. There must be 4 minimum touches (two upper TL and two lower TL) and six maximum. 
The TLs provide an objective place to buy when price breaks out over the upper TL. 3/19/24
Mr. WizardMr. Wizard
I'd probably redraw the lower TL to hit the candle's bodies and not the lower wicks. Then the pattern is still a falling wedge at the beginning, but when the price action just kind of peters out towards the apex, there's no pattern left, and I haven't seen an attempt to break out upwards. No trade if this is the case. 
Just my opinion, but I'd probably give it a pass. 3/19/24
YummyTradeYummyTrade
Appreciate the extra info! I never quite know where to draw the lines, glad to see your comment about placing the points on the candle bodies. The additional information about a minimum of 4 line touches is what I really wanted to know. I've searched on line and most of what I found was generic. Glad to have the 4 min 6 max guideline (understood that rules are only rules until they are broken LOL). Thanks for the help! 3/21/24
...