Log In
|
Create Account
Chart
AI Chart Analysis
Chart Lab
Drawn Objects ➟
Earnings Reactions
Guide to Patterns ➟
Modes ➟
Power Features ➟
Rotation Graphs
SlopeCharts
Yield Curve
Equities
Biggest Stocks
Calendar of Earnings
Correlations
Earnings ➟
Historical Earnings
Market Capitalization
Power Screener
Super Summary
Volume/Price Leaders
Woulda Shoulda
Markets
CryptoStream LIVE
Economic Database
Global Economics
Heatmap
Macroeconomics
Market Meter
MetaSymbols
Quad Matrix
SlopeRules
Watch Lists
Options
Analytics ➟
Backtest Strategies
Earnings Calendar
Extreme Options
Historical Charts
Matrix of Volatility
Open Interest & Volume
Payoff Analyzer
Strategy Explorer
Volatility Calendar
Read
Automatic Reports
Best Posts of All Time
Books by Tim Knight
Guide to Comments
Latest Posts
Mobile Apps
Profile of Your Host
Recommended Books
Ticker Stripper
Trading Rules
Social
Browse Chart Database
Comments Search
Hall of Fame
Members Directory
Publishing/Subscribing
Recent Activity
Search SlopeRules
Shared Labels & Lists
SlopeTalk LIVE
Trader’s Diary
Help
Best Pages for You
Charts Overview
Guide to the Site
Membership Levels
Pattern Video Library
Power Screener Guide
Premium Memberships
SlopeCharts Reference
SlopeCharts Videos
Video Tutorial
Log In
Create Free Account
Memberships
Recent
: slopechart_RYAN.jpg
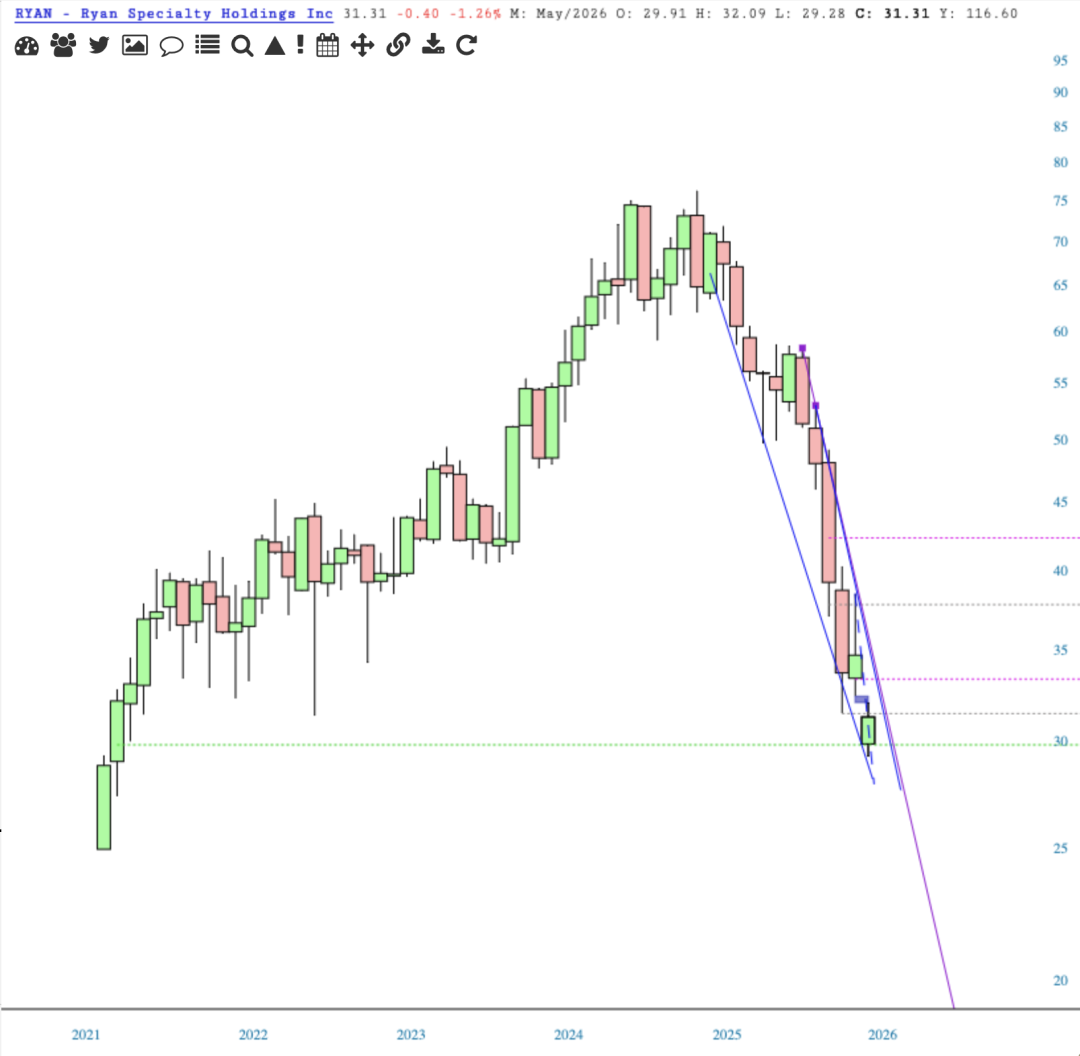
slopechart_RYAN.jpg
RYAN - Bullish breakout crossing the blue dashed line at 31.50.
Gap at 33.39 and up at 42.42.
Image added via
SlopeCharts
Comments
Violet
3 weeks 4 days ago
Claws AI
Same applies to this. You get a temporary breakout which likely kisses the 8 EMA and then kisses the 30 EMA. But the 8 must cross the 30 before you get the main event.
3 weeks 4 days ago
...
Actions
Tweet
Facebook
Stacks
Financial
RYAN
Posted
By:
Violet
3 weeks 4 days ago
On:
5/8/26 5:41PM
Statistics
Viewed by 6 SocialTraders
Only rated by one SocialTrader:
Rated By
 Violet