User: Bravo: Long Term Charts
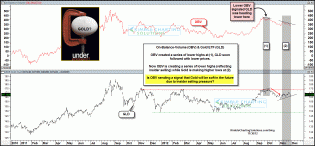
goldobvsellingpressurenov301.gif (1575×730)

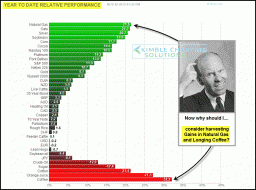
oneyearperformancenov28th1.gif (894×662)

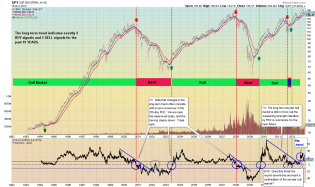
500viximportantkissnov261.gif (1575×728)
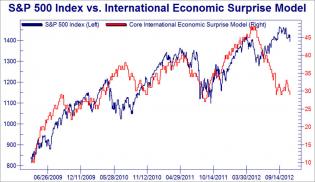
Business Cycle Investing - David Calloway - Public ChartList - S...


20121112_SPX1.png (710×384)
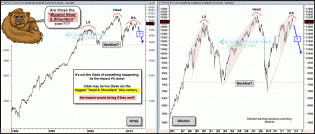
3
dshort Featured Charts
20121109_ECO.jpg (995×577)
2
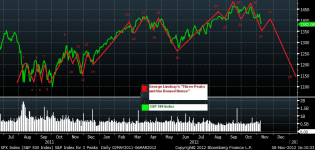
ThreePeaksandtheDomedHouse4pm_20121108.png (982×468)
nysewilshirehugehandspatternoct25.gif (1561×666)
1109-spx.png
qe3injectionsupportnov7.gif (1558×664)
1
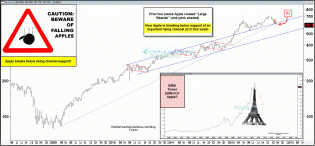
applebreakskeychannelsupportnov2.gif (1577×731)
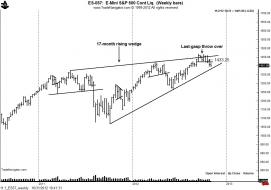
11.1_ES57_weekly
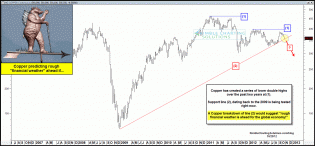
copperroughweatheraheadoct291.gif (1577×732)
20121029_CB1_1.png (556×441)
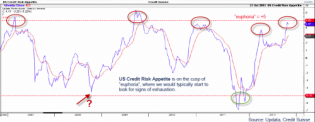
Credit risk.png

dshort Featured Charts
1
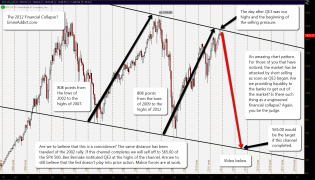
2012crash_001
1
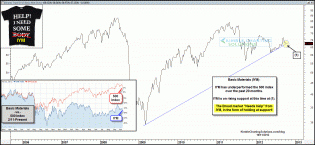
iymneedhelpoct11.gif (1575×729)

dshort Featured Charts

dshort Featured Charts
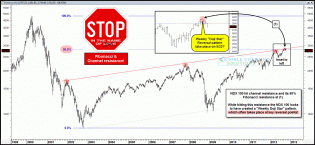
ndxstopinthenameoffiboct9.gif (1577×730)
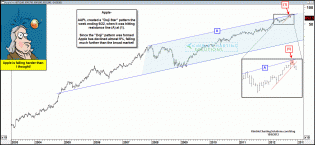
appledojistaroct8.gif (1576×728)
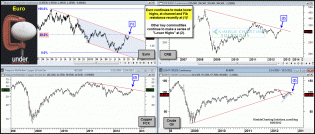
eurounderpressureoct8.gif (1561×666)

![01+-+SP500-2012-09-15[1].jpg](https://s3.amazonaws.com/cdn2.socialtrade.com/st/shards/5028_IcyVyryU_h)
01+-+SP500-2012-09-15[1].jpg

![02+-+SP500-2-2012-09-15[1].jpg](https://s3.amazonaws.com/cdn2.socialtrade.com/st/shards/5029_3FO4a8hz_h)
02+-+SP500-2-2012-09-15[1].jpg
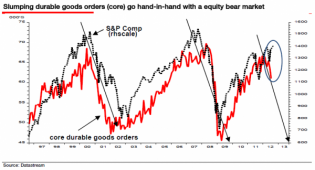
durable goods orders with sp_zps962139ac.png (600×324)

1
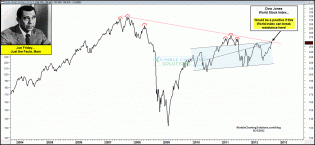
joefridaydjworldindexresistancesept21.gif (1574×727)
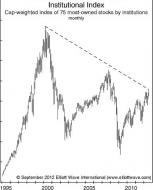
Mostownedstocks.jpg (385×477)
1
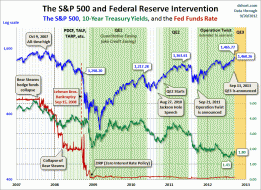
Treasury Yield Snapshot
20120925_fib.png (714×384)
1
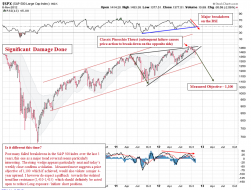
SPX

Dow Industrials
SPX-index.png (1307×699)
2