User: cekk99: Macro charts
My Blog

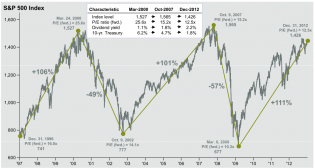
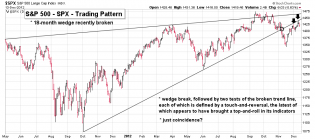
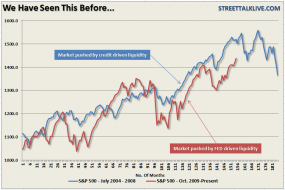
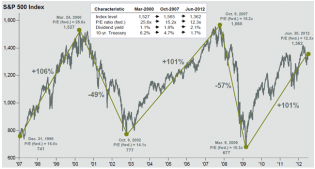
SP-500-97-2012.png (1057×566)

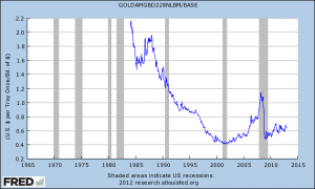
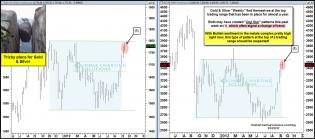
gold and base

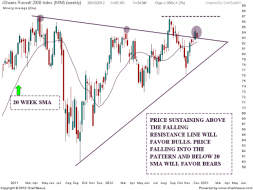
IWM Chart analysis | Nifty charts and latest market updates

SharePlanner Reversal Indicator 12-27-12

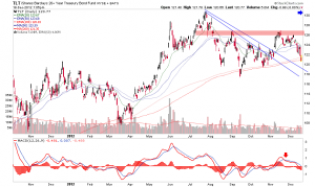
tlt
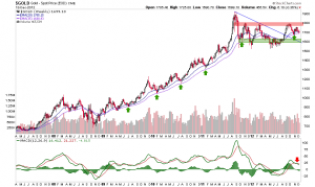
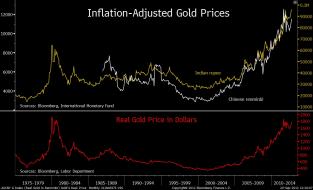
gold
bikinianalytics.com/wordpr...y-14dec12.png

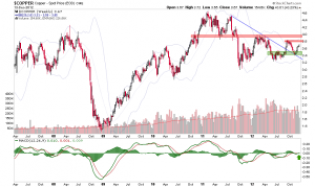
copper
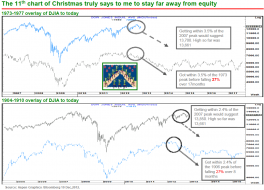
20121213_citi11.png (1030×740)
chinafxistrongoflatedec10.gif (1574×727)
fcxcopperbouncedec6.gif (1575×728)
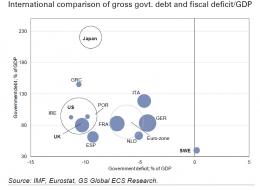
Debt-to-GDP Charts
coppersupportnyseneedstoholdnov14.gif (1575×729)
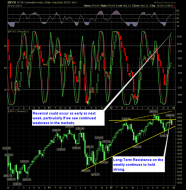
500luckychartrepeatingrisingwedgesnov104.gif (1576×725)
dollar10yearchannelhurdlenov7.gif (1576×729)
1
qe3injectionsupportnov7.gif (1558×664)
1
joefridayeurobreakingsupportnov22.gif (1573×727)
crxbreaksshorttermsupportoct30
crudeoil500indexendofflagoct25.gif (1574×729)
dow70yearchannelrisingwedgeoct23.gif (1576×730)
iyrheadandshouldersfalloct23.gif (1575×732)
eurodollarhammertimeoct23.gif (1577×733)
eurofcxfallingresistanceoct18.gif (1558×662)
chinastrengthresistancetestoct17.gif (1576×730)
europullingthe500higheroct17.gif (1575×729)
highyieldfundsabove50reflectingrsoct162.gif (1560×665)
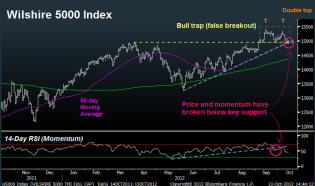
Wilshire5000bearishducks
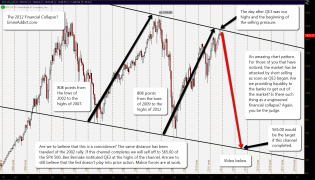
2012crash_001
1
dollarrallyclosefishmouthoct9.gif (1577×729)
joefridaydjworldindexresistancesept21.gif (1574×727)
eurounderpressureoct8.gif (1561×666)
joefridaygoldsilveratchannelresistanceoct5.gif (1576×693)
shanghaineedsbounceoct4.gif (1577×729)
dshort Featured Charts
1
30yeartltfoolyouoflatesept27.gif (1560×666)
tltcountertrendrallysept25.gif (1581×734)
goldsilverweeklydojistarsept24.jpg (1560×692)
eerw.png (607×453)
0920chart.jpg (1280×776)
Treasury Yield Snapshot
dshort Featured Charts
1
transportsdrivethruresistancesept13.gif (1576×729)
joefridaycurrencytrendreversalsept14.gif 1,562×665 pixels
1
slvslwatresistancesept11.gif (1558×660)
1
tltheadandshoulderssept12.gif (1576×730)
The Modern World_1.jpg (818×596)
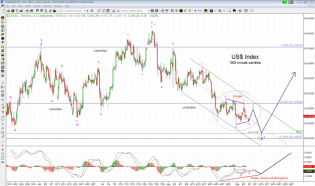
US Dollar Index 360m 9-6-12

dshort Featured Charts
Screen Shot 2012-09-04 at 9.47.04 PM.png

1
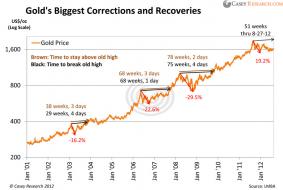
GoldsBiggestCorrectionsandRecoveries_0.jpg (792×530)
bricvsussept5.gif (866×320)
jnkhyg500breakstruggleatresistancesept4.jpg (1562×669)
bricsbreaksupportsept5.gif (1559×661)
dollarbullisticjuly31.jpg (1577×729)
dollarbernakebullshrankthesept5.jpg (1577×731)
bkxregionalresistanceaug292.gif (1560×692)
20120829_BRIC.png (720×378)
dshort Featured Charts
eemdangersouskissaug30.gif (1577×730)
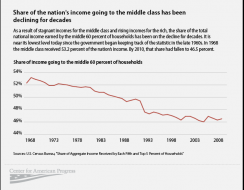
MiddleClassGraphs_web_21.png (621×482)

Government Spending as Percentage of GDP
dshort Featured Charts
1
dbdollarabouttochangedirectionaug271.gif (1569×693)
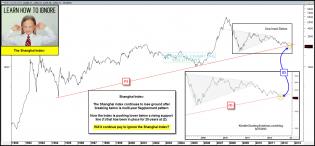
shanghailearntoignoraug27.jpg (1578×732)
Secular Bull and Bear Markets
Secular Bull and Bear Markets
2
Secular Bull and Bear Markets

fff4.png (412×357)
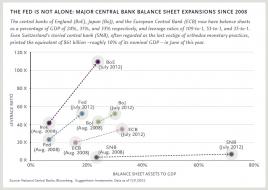
Central banks.jpg (951×674)
1
Gold, Dollar & Rates Say No QE
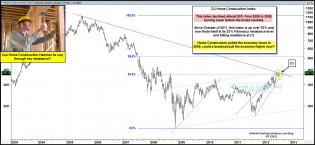
homebuildersresistanceaug13.jpg (1577×730)
1
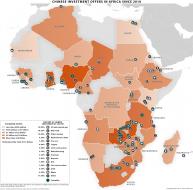
Africa_china_investments_v2.jpg (1280×1254)
1
120306-Chart-1.gif (622×449)
1
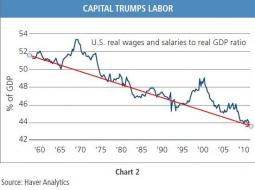
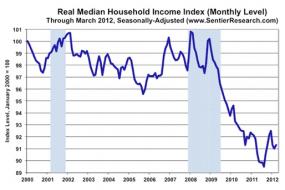
8-5-12_WagesGDP.jpg (550×409)
1
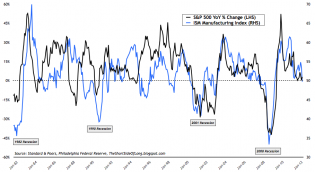
S&P+vs+ISM.png (909×498)
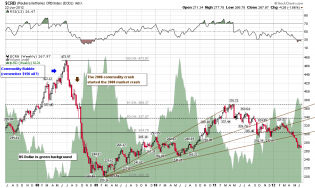
$CRB

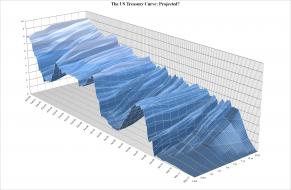
UST Curve Projected.jpg (2273×1484)
6
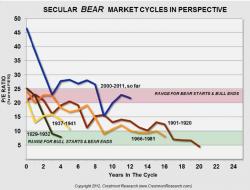
Bear Markets In Perspective.jpg (725×549)
http://rpseawright.files.wordpress.com/2012/07/math-of-loss1.png
3
dshort Featured Charts
1
Graph-3.jpg (514×342)

1
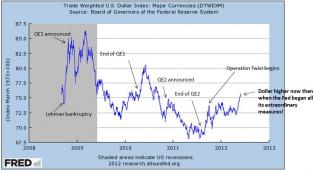
dollar index since lehman.JPG

06-06-12-US-FED-QE-III-Intervention-Timeline-LTRO-Operation_Twist-Q...
0522-euro

1
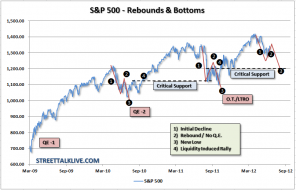
sp500-marketupdate-061912.png (807×517)
5
7-6-12-Daily-SP-w-above-200-day-MA.gif (750×611)
Chart In Focus