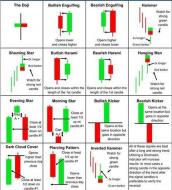
Browse Stacks: Patterns: Candlesticks
slopechart_SPY.jpg

1
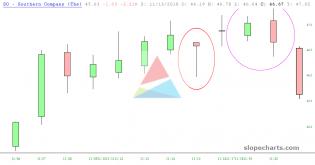
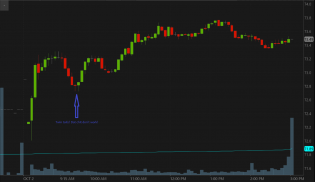
slopechart_SOUN.jpg
tryin' hard

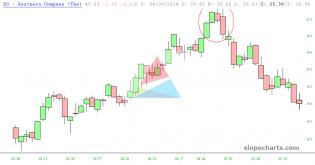
slopechart_SMR.jpg
Beautiful today
1
slopechart_SPY.jpg
Bearish, yes, bearish engulfing, lol
1
slopechart_CVNA.jpg
spinning top, will it hold?
slopechart_SMCI.jpg
super bearish engulfing
1
slopechart_OPEN.jpg
Open to a fall
slopechart_HYG.jpg
mind the canary
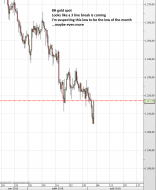
gold.jpg
Potential double bottom on /GC (gold) here. I say potential because it isn't confirmed yet.

slopechart_HUSA.jpg
My first Harami Cross!

2
slopechart_IBM.jpg
So excited to have spotted this one. I wish I would of taken advantage of it yesterday - but I actually kind of f...
slopechart_XRT.jpg
Beautiful topping candle, if it holds
slopechart_BOOT.jpg
Note that every reversal starts with Bearish Engulfing Pattern. Why not back to $40 - $60 per share?
slopechart_CERE.jpg
Compliments of Candle Hunter. 4 Bears.
slopechart_UAL.jpg
a bunch of hammer up candles at what could be dip bottoms Friday in the airlines

slopechart_IMAX.jpg
Classic reversal candle - the hammer down
1
SOAP_GME.jpg
slopechart_ACB.jpg
cup and handle ACB stack

1
slopechart_BIG.jpg
The breakout didn't hold and has fallen back below both horizontals. Today's harami suggests a momentum halt to th...
slopechart_ECL.jpg
Good spot to head higher at long term horizontal with a hammer up candle today.
VolatilityGrid_MRNA.jpg
slopechart_JMIA.jpg
Dipped to the 13 EMA and made a bullish engulfing
slopechart_QQQ.jpg
Weird daily candle. Opened with a clear horizontal and pennant bullish breakout, closed a bearish engulfing candle...
1
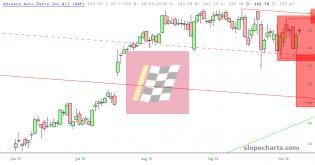
slopechart_AN.jpg
Horizontal lost with gusto.
Evening star candlestick formation in red circle.
slopechart_FDX.jpg
bearish engulfing candle today near upper trendline top
slopechart_SE.jpg
bearish engulfing candlestick
slopechart_REG.jpg
Spinning top doji. Price has fallen back once again to the last high fractal that can be turned to support. I expe...
slopechart_DKS.jpg
Bearish engulfing. I just don't know if I want to get involved with Dicks.
2
slopechart_GSX.jpg
All time high. Hammer down. Perfect shorting opportunity.
slopechart_WORK.jpg
I am long. Need that trendline to hold. That harami candlestick makes me feel a little better, at least for today.
2
slopechart_AAXN.jpg
Body cams and tasers

slopechart_ITW.jpg
Another bearish engulfing pattern
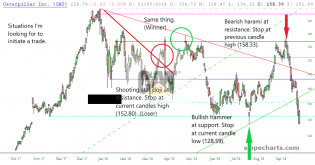
slopechart_CAT.jpg
Piercing candlestick pattern
slopechart_BAC.jpg
Hanging man pattern on BAC?
slopechart_BRK.B.jpg
Grandpa Munster is probably toast. Apologies to Bill Maher and Senator John McCain.
3
slopechart_$SPX.jpg
Rising in the counter trend rally we've hit a lot of resistance at 50%, and after yesterday's move have a bearish...

Spx-reversal-of-misfortune-doji-star-reversal-at-161-level-possible...

1
s3.amazonaws.com/cdn2.soci..._lALLr3_l.png
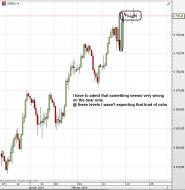
NQ test of support
slopechart_SPY.jpg
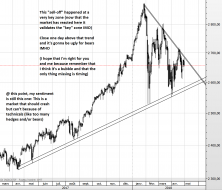
Today I'm dreaming about a reversal island for tomorrow just above of the 2009 trendline, that would do the trick :D

2
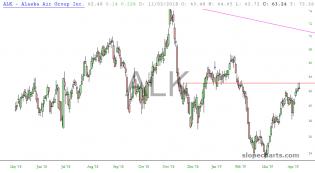
slopechart_ALK.jpg
A short idea from TK last week with a slightly better entry price if you are still bearish. Lower highs lower lows...
s3.amazonaws.com/cdn2.soci..._jX6uM4_l.png
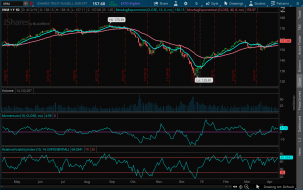
Crossover of the 10 and 40 EMA. Bullish.

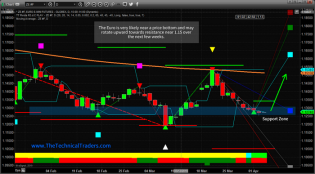
Euro Dollar Price Bottoming Setup – Technical Traders Ltd.
Euro Dollar

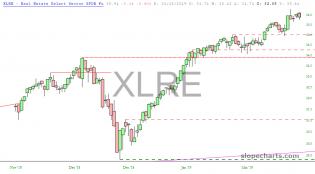
slopechart_XLRE.jpg
Shooting star 3/22 followed by bearish engulfing today 3/27. I'm already short via a long 36 put with May expiration.
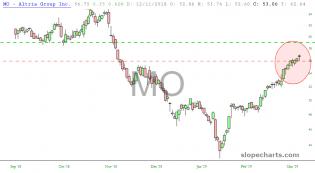
slopechart_MO.jpg
2 hanging man candlesticks in the space of 7 days.
1 feb20.PNG

1
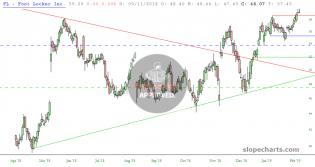
slopechart_FL.jpg
$FL twin tails formed Friday encouraging for bears
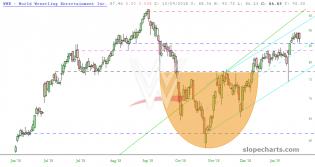
slopechart_WWE.jpg
$WWE bearish engulfing from Friday encouraging for bears
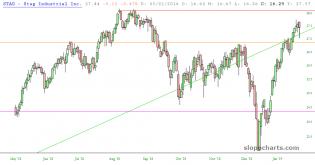
slopechart_STAG.jpg
Bearish engulfing.
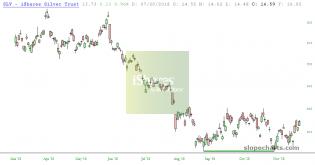
slopechart_SLV.jpg
Double bottom.
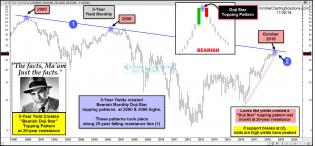
joe-friday-5-year-yields-bearis-doji-start-topping-pattern-at-20-ye...
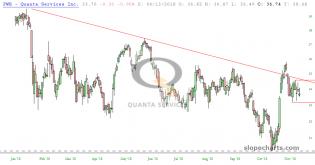
slopechart_PWR.jpg
NR7 pattern completed today 1.43 wide.
slopechart_TD.jpg
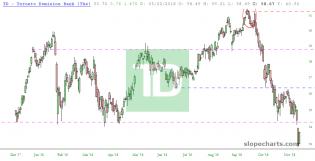
Bearish engulfing at the tippy top. Bullish harami currently at the bottom of this dive. This puppy looks bad.

slopechart_JPM.jpg
Candlestick patterns with common stops.
Red - Inverted hammer (gravestone doji)
Pink - Bearish engulfing
Blue -...
1
slopechart_HBAN.jpg
Evening star almost perfect rejection off the bottom of failed bull trendline. I'm thinking buying the 14P can't b...
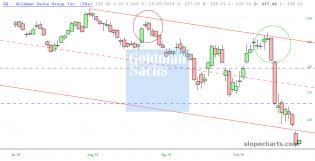
slopechart_GS.jpg
Another bearish engulfing on one top and the elusive and rare 3 strike bar on another.
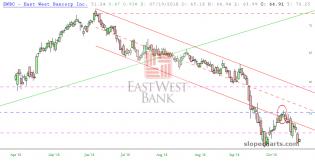
slopechart_EWBC.jpg
Hanging man candlestick followed by fall back below the bearish trendline. I would be looking for a bounce back to...
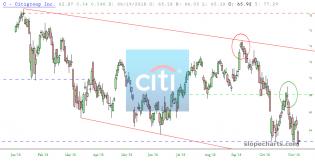
slopechart_C.jpg
Bearish engulfing at one top. Bearish harami at another. Both with follow through.
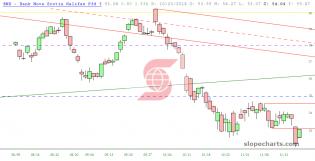
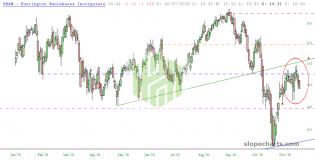
slopechart_BNS.jpg
NR7 bearish breakout. Target of 51.72 not hit yet.
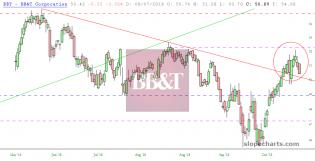
slopechart_BBT.jpg
An almost perfect bearish fractal. Coming at a retest of breakout of bearish trendline. Worth keeping an eye on.
1
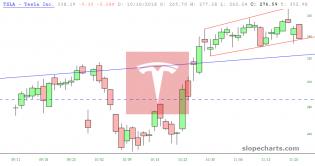
slopechart_TSLA.jpg
Evening star with follow through.
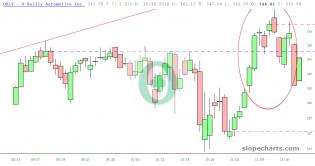
slopechart_ORLY.jpg
Evening star followed by bearish engulfing. That would be another evening star right after but it's not at a top.
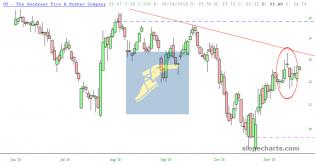
slopechart_GT.jpg
Evening star no follow through.
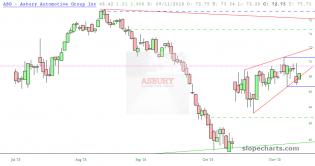
slopechart_ABG.jpg
Triple NR7 pattern with latest breakout lines (blue) and target prices (green dash).
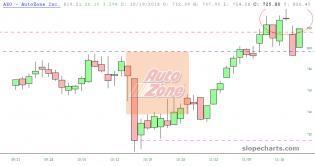
slopechart_AZO.jpg
Evening star no follow through.
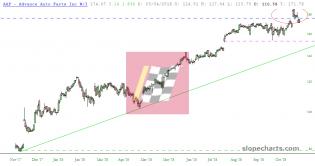
slopechart_AAP.jpg
Bearish engulfing with follow through.
s3.amazonaws.com/cdn2.soci..._2pfv3Z_l.jpg
These are all I use. Along with trendlines and horizontals.
slopechart_SO.jpg
Successful bearish harami. Not current.
1
slopechart_SO.jpg
Hanging man candlestick in red circle.
Bearish engulfing 2 candlestick pattern in pink circle.
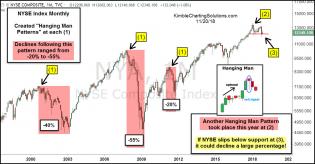
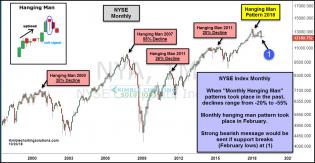
nyse-hanging-man-pattern-average-declines-nov-20.jpg (1227×641)
1
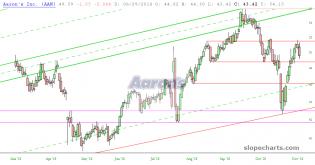
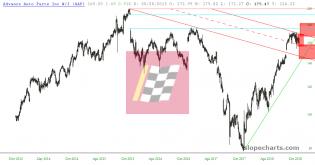
slopechart_ABG.jpg
Here is one that's perplexing me. A 3 week ascending wedge (makes me want to lean bearish) containing 2 NR7 patter...
1
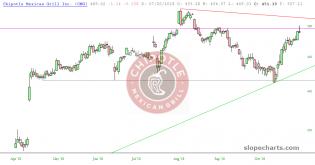
slopechart_CMG.jpg
Shooting star candlestick. Might be worth a quick scalp if you can catch a bounce tomorrow.
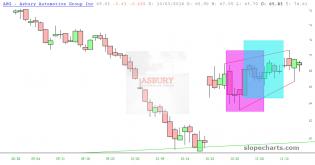
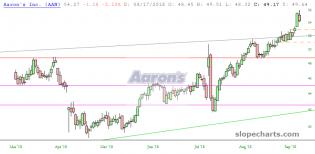
slopechart_AAN.jpg
Bouncing off horizontal resistance and bearish engulfing. Left a GTC order for a debit put spread Dec21 55-49 at $...

slopechart_ORCL.jpg
slopechart_AAP.jpg
Closer look at NR7 pattern. Upper breakout target 179.91. Lower breakout target 145.74.
1
slopechart_AAP.jpg
NR7 pattern with price target ranges. Upper breakout target 179.91. Lower breakout target 145.74.
NYSE-hanging-man-pattern-declines-oct-23.jpg (1236×642)
4
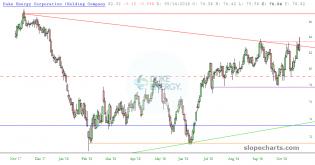
slopechart_DUK.jpg
There's a nice bearish candle. Stop 84. Target 79.
CAT_102218.png
The way I trade currently.
2
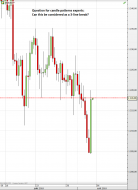
WBA_10218_twintails.PNG
Twin tails on 5min chart today. Does that stuff really work?
2
slopechart_CAKE_92718.jpg
Candle Hunter screening.
slopechart_AAN.jpg
Bearish harami. If tomorrow's candle closes below 54.15 I will open a short position with a stop at 56.
3
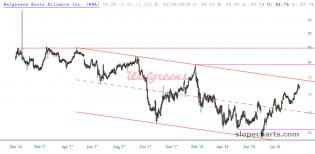
slopechart_WBA.jpg
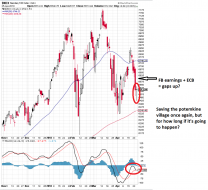
Approaching top side of descending channel. Hanging man candle with follow through. Earnings in 17 days. I will be...
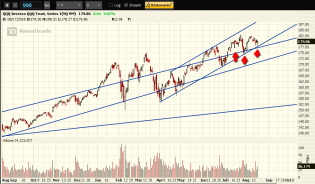
s3.amazonaws.com/cdn2.soci..._FdH6Ws_l.png
$QQQ and NQ double hammer on support. Possible IHS.
4 aug3.PNG
1
1 aug3.PNG
3 apr30.PNG
7
3 apr26.PNG

1 apr20.PNG
112.png

5
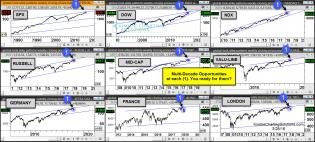
global-9-pack-multi-decade-opportunities-march-28.jpg (1561×705)
weekly markets analysis
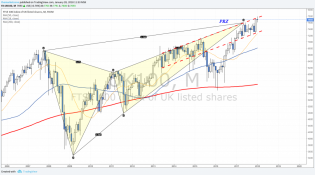
UK100 - Re-test of PRZ and trading channel top

weekly markets analysis
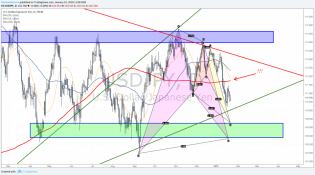
USDJPY - Moving inside Triangle pattern - Two harmonic patterns in focus
weekly markets analysis
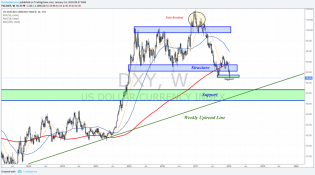
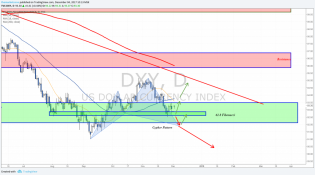
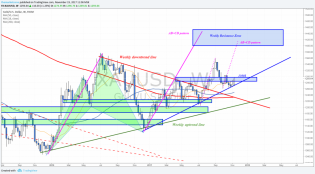
DXY closed below weekly support - Read more in this week's newsletter
weekly markets analysis
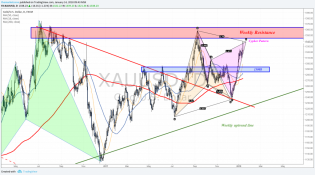
XAUUSD approaching resistance - Read this week's newsletter for more info
weekly markets analysis
XAUUSD is approaching a weekly support zone following last week's breakdown
weekly markets analysis
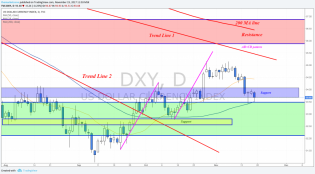
DXY - Holding support but still stays below resistance
Weekly Markets Anlaysis
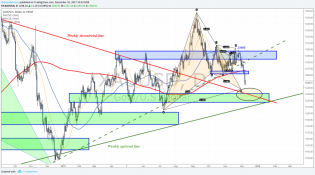
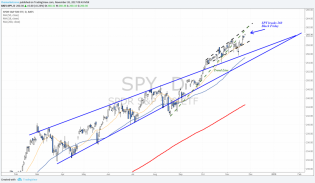
SPY - Broadening Top, Bollinger Bands, RSI - All signs indicate that we won't see Year End Rally this year... but!
weekly markets analysis
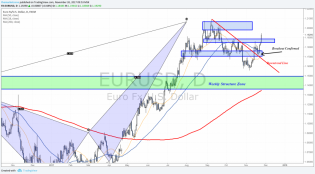
EURUSD will break 1.2 following a bullish breakout
weekly markets analysis
Gold will be testing 1300$ as resistance again.
Several Harmonic Patterns to monitor in this week's newsletter
weekly markets analysis
DXY testing support - Will it bounce back to 95-96?