User: Holy Hand Grenade: Moving Averages: KORS.jpg

KORS.jpg

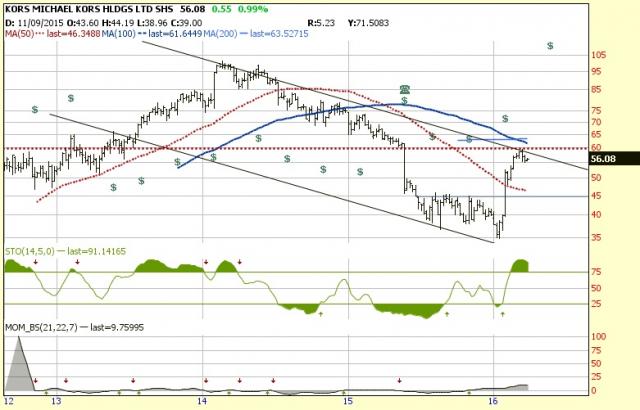
KORS: I see a 100 week moving average crossing a 200 week moving average. I see buying exhaustion after a 71% rally within 90 days. I see resistance as we hit a 2 year old bear channel. And I see a nice lateral pivot line, shown in dotted red. I see no top-line growth, huge stock buybacks (now over) and lower tax rates masking its collapsing operating margins.

Comments

daButcherdaButcher
I see................................... 3/28/16
Benjermin FranklinBenjermin Franklin
i see a market that wants to help it drop! i like the short 3/28/16
Herd_MentalityHerd_Mentality
Zoom out to the weekly...$60 level was the big drop last June...so natural to find resistance there...nothing bearish in the weekly. 3/28/16
Holy Hand GrenadeHoly Hand Grenade
Having said that, it is still cheap in valuation terms., but reminds me of retail ETF chart, which is hitting fibo resistance after a large move up. 3/28/16
Holy Hand GrenadeHoly Hand Grenade
BTW, the chart above is a weekly chart. 3/28/16
...