User: House of Cards: charts
Gold Scents: BEAR MARKET BOTTOMS: ONCE-IN-A-LIFETIME OPPORTUNITIES
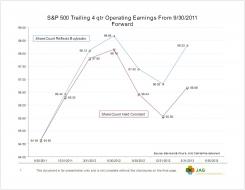
There's still a chance to get that PE ratio down where it should have gone in 2009.

Mish's Global Economic Trend Analysis
This chart is so perfect it seems impossible that it is true.
2
Chart
Okay, so a big cut of the "earnings" are from stock buybacks. Where's the chart that shows how much of earnings i...
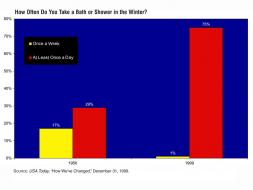
It's Getting Better bath shower winter
People are showering every day; hard to see this as anything but a good thing.
1
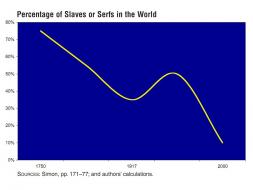
It's Getting Better slaves serfs
Though the chart suggests slavery is disappearing, I submit that it's time to catch a falling knife; today's world...
1
apple-earnings-charts-1q13
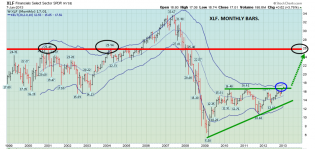
2013jan8xlf2.png 1,195×569 pixels
1
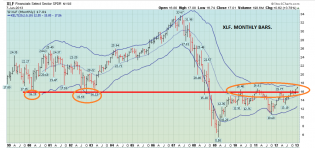
2013jan8xlf1.png 1,205×568 pixels
self_description
apple-stock-charts.jpg 620×384 pixels
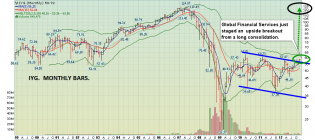
2012dec18iyg.png 993×444 pixels
Graphic
1
Chart
Stock Market Analysis for the Nasdaq

Click to View
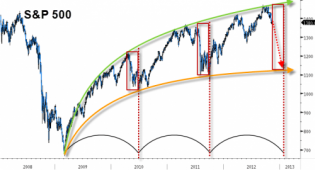
The Strange (and Worrisome) Symmetry Of Bernanke's Bull Market |...
1
25457.png
chart
content.screencast.com/use...SPX101012.gif

IWM Weekend update | Nifty charts and latest market updates

321gold.com/editorials/sfs.../usd_time.gif
2
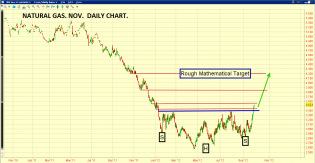
gracelandupdates.com/image...12oct2ng1.png
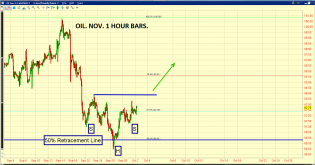
gracelandupdates.com/image...2oct2oil2.png
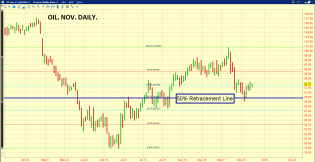
gracelandupdates.com/image...2oct2oil1.png
gracelandupdates.com/image...2oct2dow2.png
gracelandupdates.com/image...2oct2dow1.png
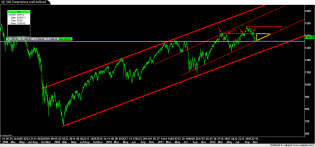
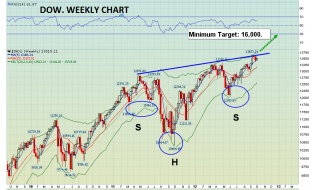
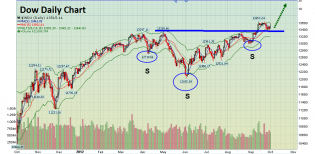
Dow Industrials
SPX
SPX
SPX index
2
Click to View
Click to View
Click to View
SPX
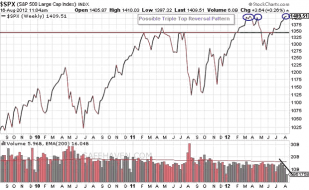
triple top?
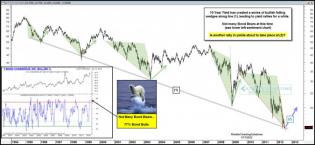
10yearyieldabouttorallyjuly17

Short Side Of Long
2
XRT-XLP-spread vs SPX

321gold.com/editorials/sfs...d_top_hat.gif
321gold.com/editorials/sfs...usd_hands.gif
Click to View
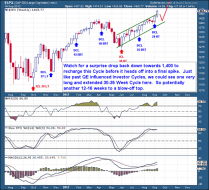
seems there is little need to worry about the "ultimate death cross"
2
Click to View
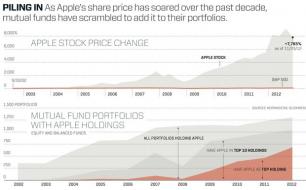
How have those stock holdings been working out for the long term 401K investors?
Mish's Global Economic Trend Analysis
Mish's Global Economic Trend Analysis
Mish's Global Economic Trend Analysis
Click to View
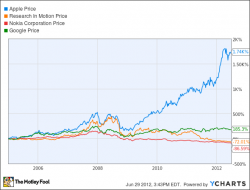
AAPL Chart
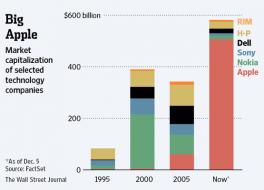
breaking news: apple trounces RIM and Nokia
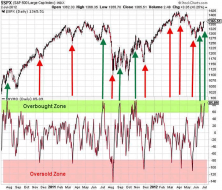
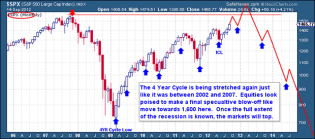
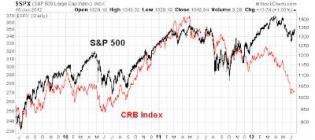
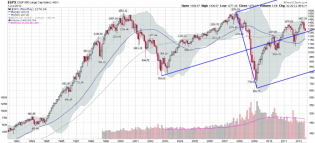
$SPX (S&P 500 Large Cap Index) INDX
1
dshort Featured Charts
Screen Shot 2012-07-02 at 7.46.42 PM
s&p
2
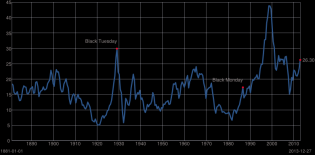
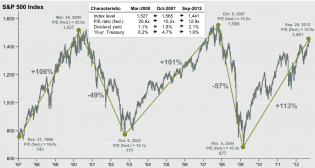
Nightmare on Wall Street
bear markets
Nightmare on Wall Street
bull markets
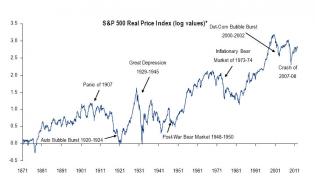
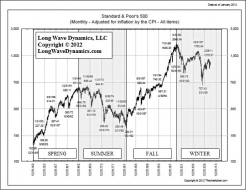
SPRealPrice.jpg
1
Click to View
was 2009 the bottom of this secular bear?
BHP7112 - tnrevolution's library
Mosaic MOS

fcx.png (1666×891)

6
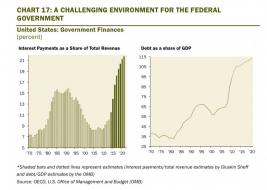
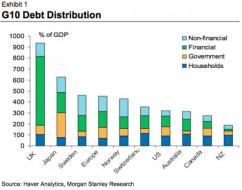
The U.S. in on a slippery fiscal slop and policymakers need to a...
us gov cost to borrow
NI062212.png (700×748)
1
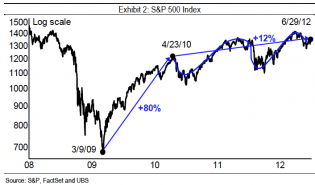
sp500-marketupdate-061912.png (807×517)

5
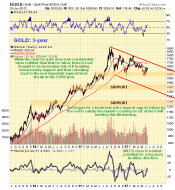
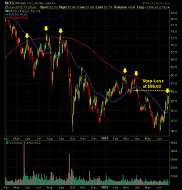
Gold 3-Year Chart
gold technically looks weak, could drop to 1400
qechart.png

4
Don't Lose Sight Of The Medium Term - Seeking Alpha
markets stop tracking business cycle
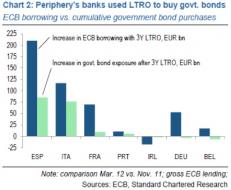
ecb borrowing.jpg
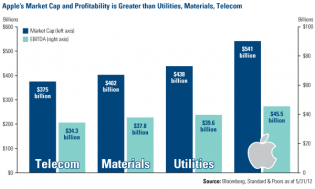
Apple's Market Cap and Profitability versus Utilities, Materials...
Apple is bigger than telecom, materials, utilities?
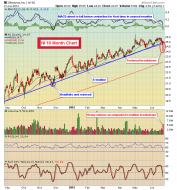
120615 SPX Weekly 13_34 EMA Crosses Analysis - springheel_jack's li...
springheel jack's 13/34 ema crossover tells
![b5794d737c08722d09c3944ee9687[1].jpg](https://s3.amazonaws.com/cdn2.socialtrade.com/st/shards/1375_Gy3f6xMR_h)
b5794d737c08722d09c3944ee9687[1].jpg

5
Cycle Low for Gold? - Mid-Day Minute for Tue June 12th 2012
EconomPic
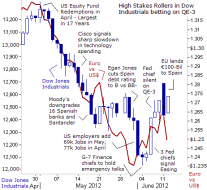
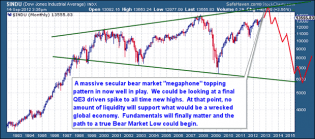
High Stakes Rollers in Dow Industrials betting on QE-3
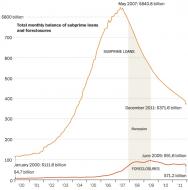
Subprime
subprime loans and foreclosures
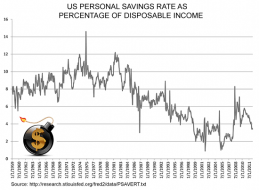
savings rate.png
personal savings rate
mcclellan
VIX and More

2
6-8-12-Daily-SP-w-above-200-day-MA.gif
from Big Picture
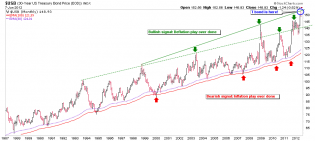
usb.png (975×438)
111.jpg
1
spx.png
1
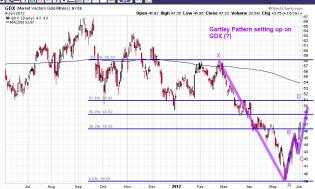
GDX 20120604 Gartley.jpg

1
0604-gdx.jpg